Logging FAQ
Indexes
- How Do I Disable Logging?
- What Can I Do If All Components Except log-operator Are Not Ready?
- How Do I Handle the Error in Stdout Logs of log-operator?
- What Can I Do If Container File Logs Cannot Be Collected When Docker Is Used as the Container Runtime?
- What Can I Do If Logs Cannot Be Reported and "log's quota has full" Is Displayed in stdout Logs of otel?
- What Can I Do If Container File Logs Cannot Be Collected Due to the Wildcard in the Collection Directory?
- What Can I Do If fluent-bit Pod Keeps Restarting?
- What Can I Do If Logs Cannot Be Collected When the Node OS Is Ubuntu 18.04?
- What Can I Do If Job Logs Cannot Be Collected?
- What Can I Do If the Cloud Native Log Collection Add-on Is Running Normally but Some Log Collection Policies Do Not Take Effect?
- How Do I Handle OOM on log-agent-otel-collector?
- What Can I Do If Some Pod Information Is Missing During Log Collection Due to Excessive Node Load?
- How Do I Change the Log Storage Period on Logging?
- What Can I Do If the Log Group or Stream Specified in the Log Collection Policy Does Not Exist?
- What Can I Do If Logs Cannot Be Collected After Pods Are Scheduled to CCI?
- What Can I Do If FailedAssignENI Is Generated When a Node Is Created in a CCE Turbo Cluster?
How Do I Disable Logging?
Disabling Container Log and Kubernetes Event Collection
Method 1: Access Logging. In the upper right corner, click View Log Policy. Locate the target log policy and click More > Delete in the Operation column. By default, the default-event policy reports Kubernetes events, and the default-stdout policy reports stdout logs.

Method 2: Access the Add-ons page and uninstall the Cloud Native Log Collection add-on. Note that after you uninstall this add-on, it will no longer report Kubernetes events to AOM.
Disabling Component Logging
Choose Logging > Control Plane Logs, click Configure Component Logging, and deselect one or more components you want to disable logging for.

Disabling Kubernetes Audit Logging
Choose Logging > Kubernetes Audit Logs, click Configure Control Plane Audit Logging, and deselect the component whose logs do not need to be collected.

What Can I Do If All Components Except log-operator Are Not Ready?
Symptom: All components except log-operator are not ready, and the volume failed to be mounted to the node.
Solution: Check the logs of log-operator. During add-on installation, the configuration files required by other components are generated by log-operator. If the configuration files are invalid, all components cannot be started.
The log information is as follows:
MountVolume.SetUp failed for volume "otel-collector-config-vol":configmap "log-agent-otel-collector-config" not found
How Do I Handle the Error in Stdout Logs of log-operator?
Symptom:
2023/05/05 12:17:20.799 [E] call 3 times failed, reason: create group failed, projectID: xxx, groupName: k8s-log-xxx, err: create groups status code: 400, response: {"error_code":"LTS.0104","error_msg":"Failed to create log group, the number of log groups exceeds the quota"}, url: https://lts.cn-north-4.myhuaweicloud.com/v2/xxx/groups, process will retry after 45s Solution: There is a log group quota on the LTS console. If this error occurs, go to the LTS console and delete some unnecessary log groups. For details about the log group quota, see Managing Log Groups.
What Can I Do If Container File Logs Cannot Be Collected When Docker Is Used as the Container Runtime?
Symptom:
A container file path is configured but is not mounted to the container, and Docker is used as the container runtime. As a result, logs cannot be collected.
Solution:
Check whether Device Mapper is used for the node where the workload resides. Device Mapper does not support text log collection. (This restriction is displayed when you create a log collection policy.) To check this, perform the following operations:
- Go to the node where the workload resides.
- Run the docker info | grep "Storage Driver" command.
- If the value of Storage Driver is Device Mapper, text logs cannot be collected.

What Can I Do If Logs Cannot Be Reported and "log's quota has full" Is Displayed in stdout Logs of otel?

Solution:
LTS provides a free log quota. If the quota is used up, you will be charged for the excess log usage. If an error message is displayed, the free quota has been used up. To continue collecting logs, log in to the LTS console, choose Configuration Center in the navigation pane, and enable Continue to Collect Logs When the Free Quota Is Exceeded.

What Can I Do If Container File Logs Cannot Be Collected Due to the Wildcard in the Collection Directory?
Troubleshooting: Check the volume mounting status in the workload configuration. If a volume is attached to the data directory of a service container, this add-on cannot collect data from the parent directory. In this case, you need to set the collection directory to a complete data directory. For example, if the data volume is attached to the /var/log/service directory, logs cannot be collected from the /var/log or /var/log/* directory. In this case, you need to set the collection directory to /var/log/service.
Solution: If the log generation directory is /application/logs/{Application name}/*.log, attach the data volume to the /application/logs directory and set the collection directory in the log collection policy to /application/logs/*/*.log.
What Can I Do If fluent-bit Pod Keeps Restarting?
Troubleshooting: Run the kubectl describe pod command. The output shows that the pod was restarted due to OOM. There are a large number of evicted pods on the node where the fluent-bit resides. As a result, resources are occupied, causing OOM.
Solution: Delete the evicted pods from the node.
What Can I Do If Logs Cannot Be Collected When the Node OS Is Ubuntu 18.04?
Troubleshooting: Restart the fluent-bit pod on the current node and check whether logs are properly collected. If the logs cannot be collected, check whether the log file to be collected already exists in the image during image packaging. In the container log collection scenario, the logs of the existing files during image packaging are invalid and cannot be collected. This issue is known in the community. For details, see Issues.
Solution: If you want to collect log files that already exist in the image during image packaging, you are advised to set Startup Command to Post-Start on the Lifestyle page when creating a workload. Before the pod of the workload is started, delete the original log files so that the log files can be regenerated.
What Can I Do If Job Logs Cannot Be Collected?
Troubleshooting: Check the job lifetime. If the job lifetime is less than 1 minute, the pod will be destroyed before logs are collected. In this case, logs cannot be collected.
Solution: Prolong the job lifetime.
What Can I Do If the Cloud Native Log Collection Add-on Is Running Normally but Some Log Collection Policies Do Not Take Effect?
Solution:
- If the log collection policy of the event type does not take effect or the add-on version is earlier than 1.5.0, check the stdout of the log-agent-otel-collector workload.
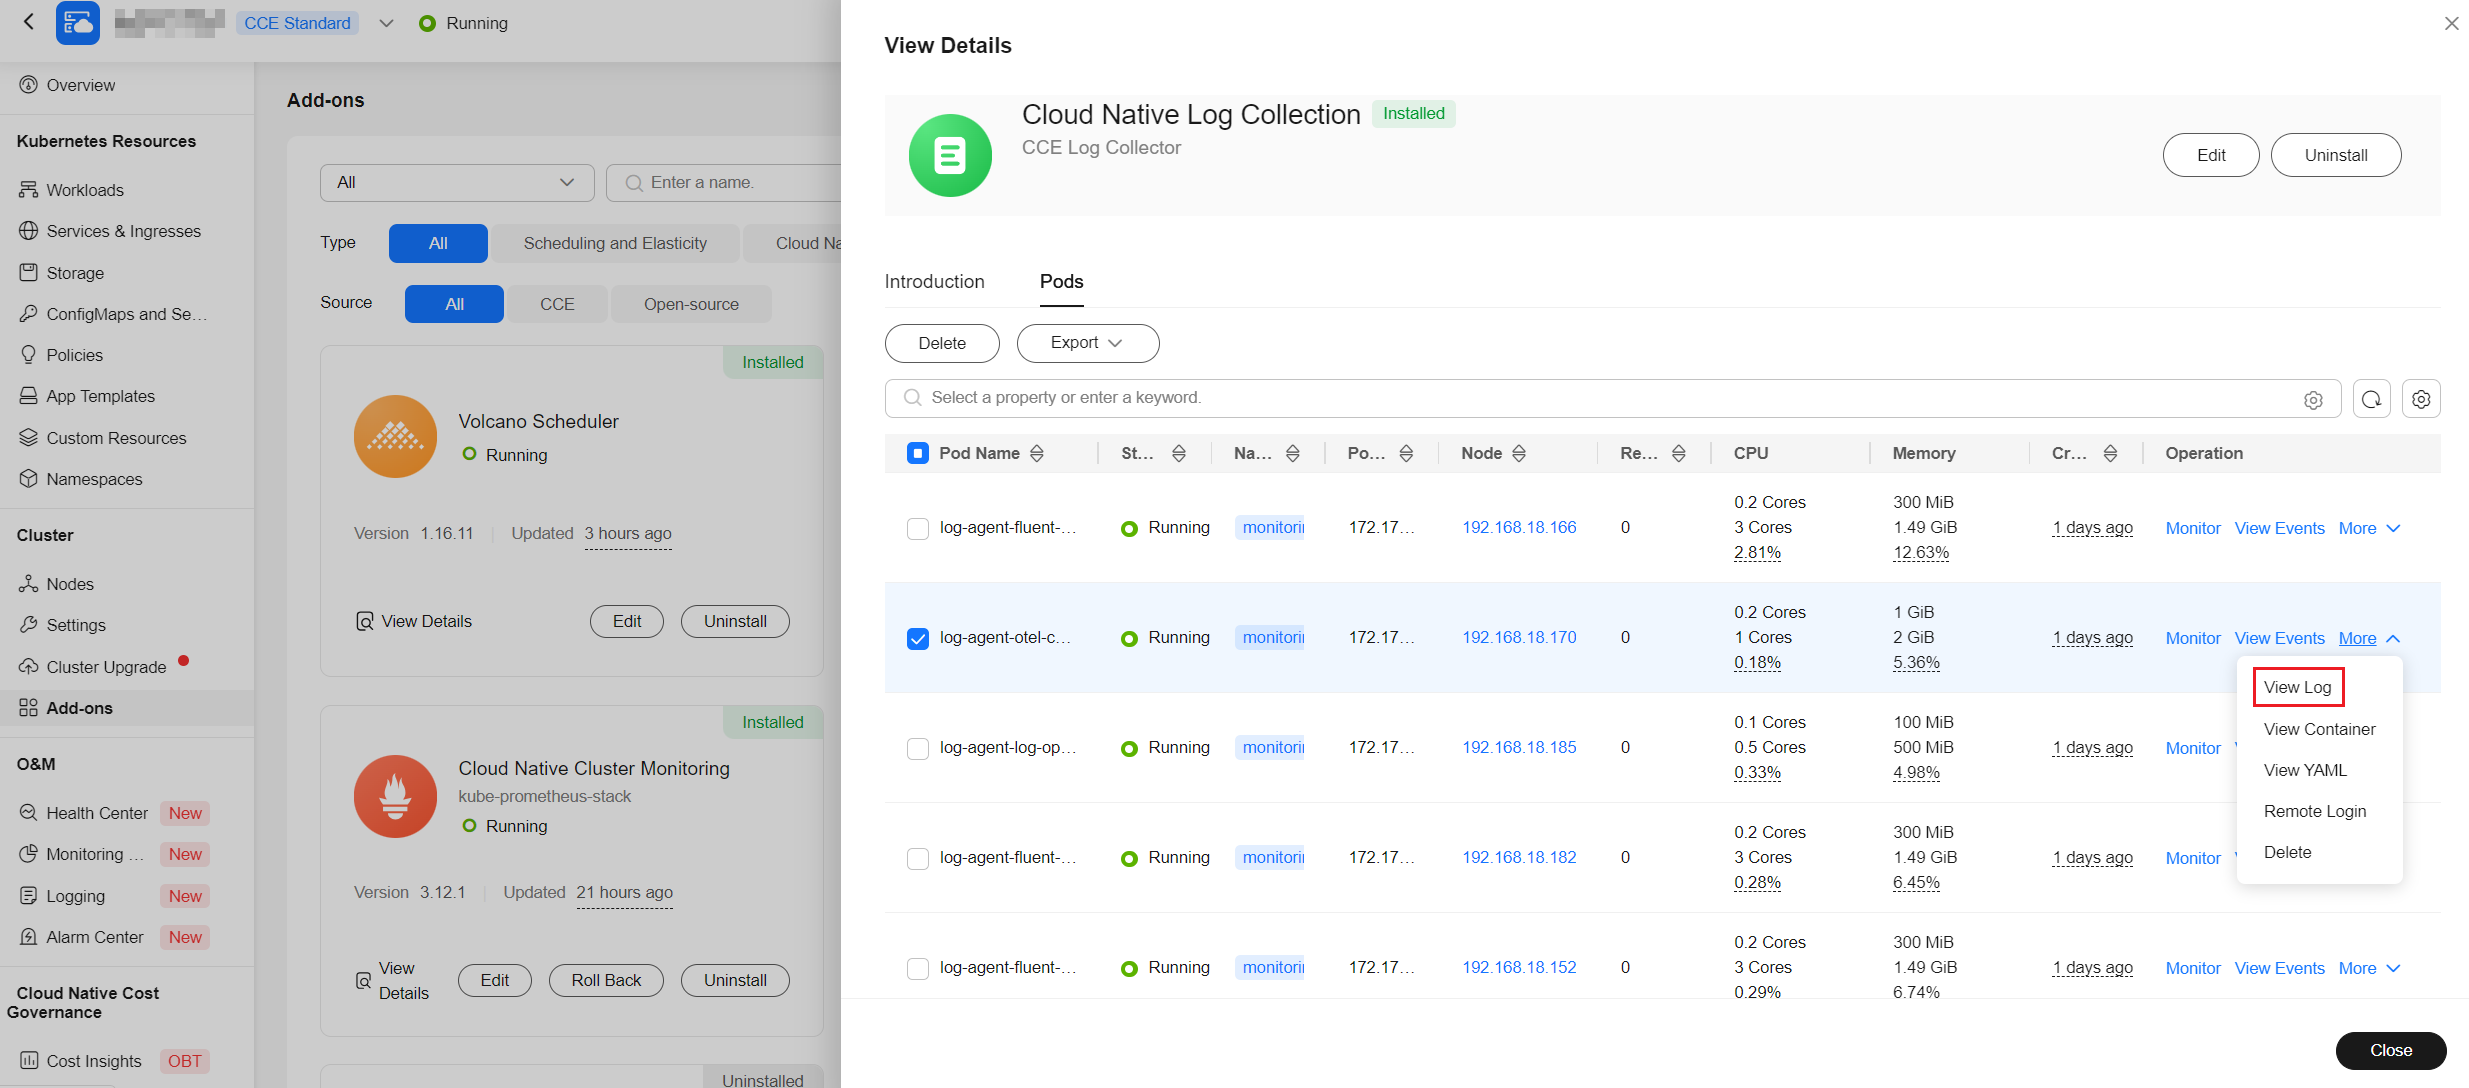
Go to the Add-ons page and click Cloud Native Log Collection. Then, click the Pods tab, locate log-agent-otel-collector, and choose More > View Log in the Operation column.
Figure 7 Viewing the log of log-agent-otel-collector
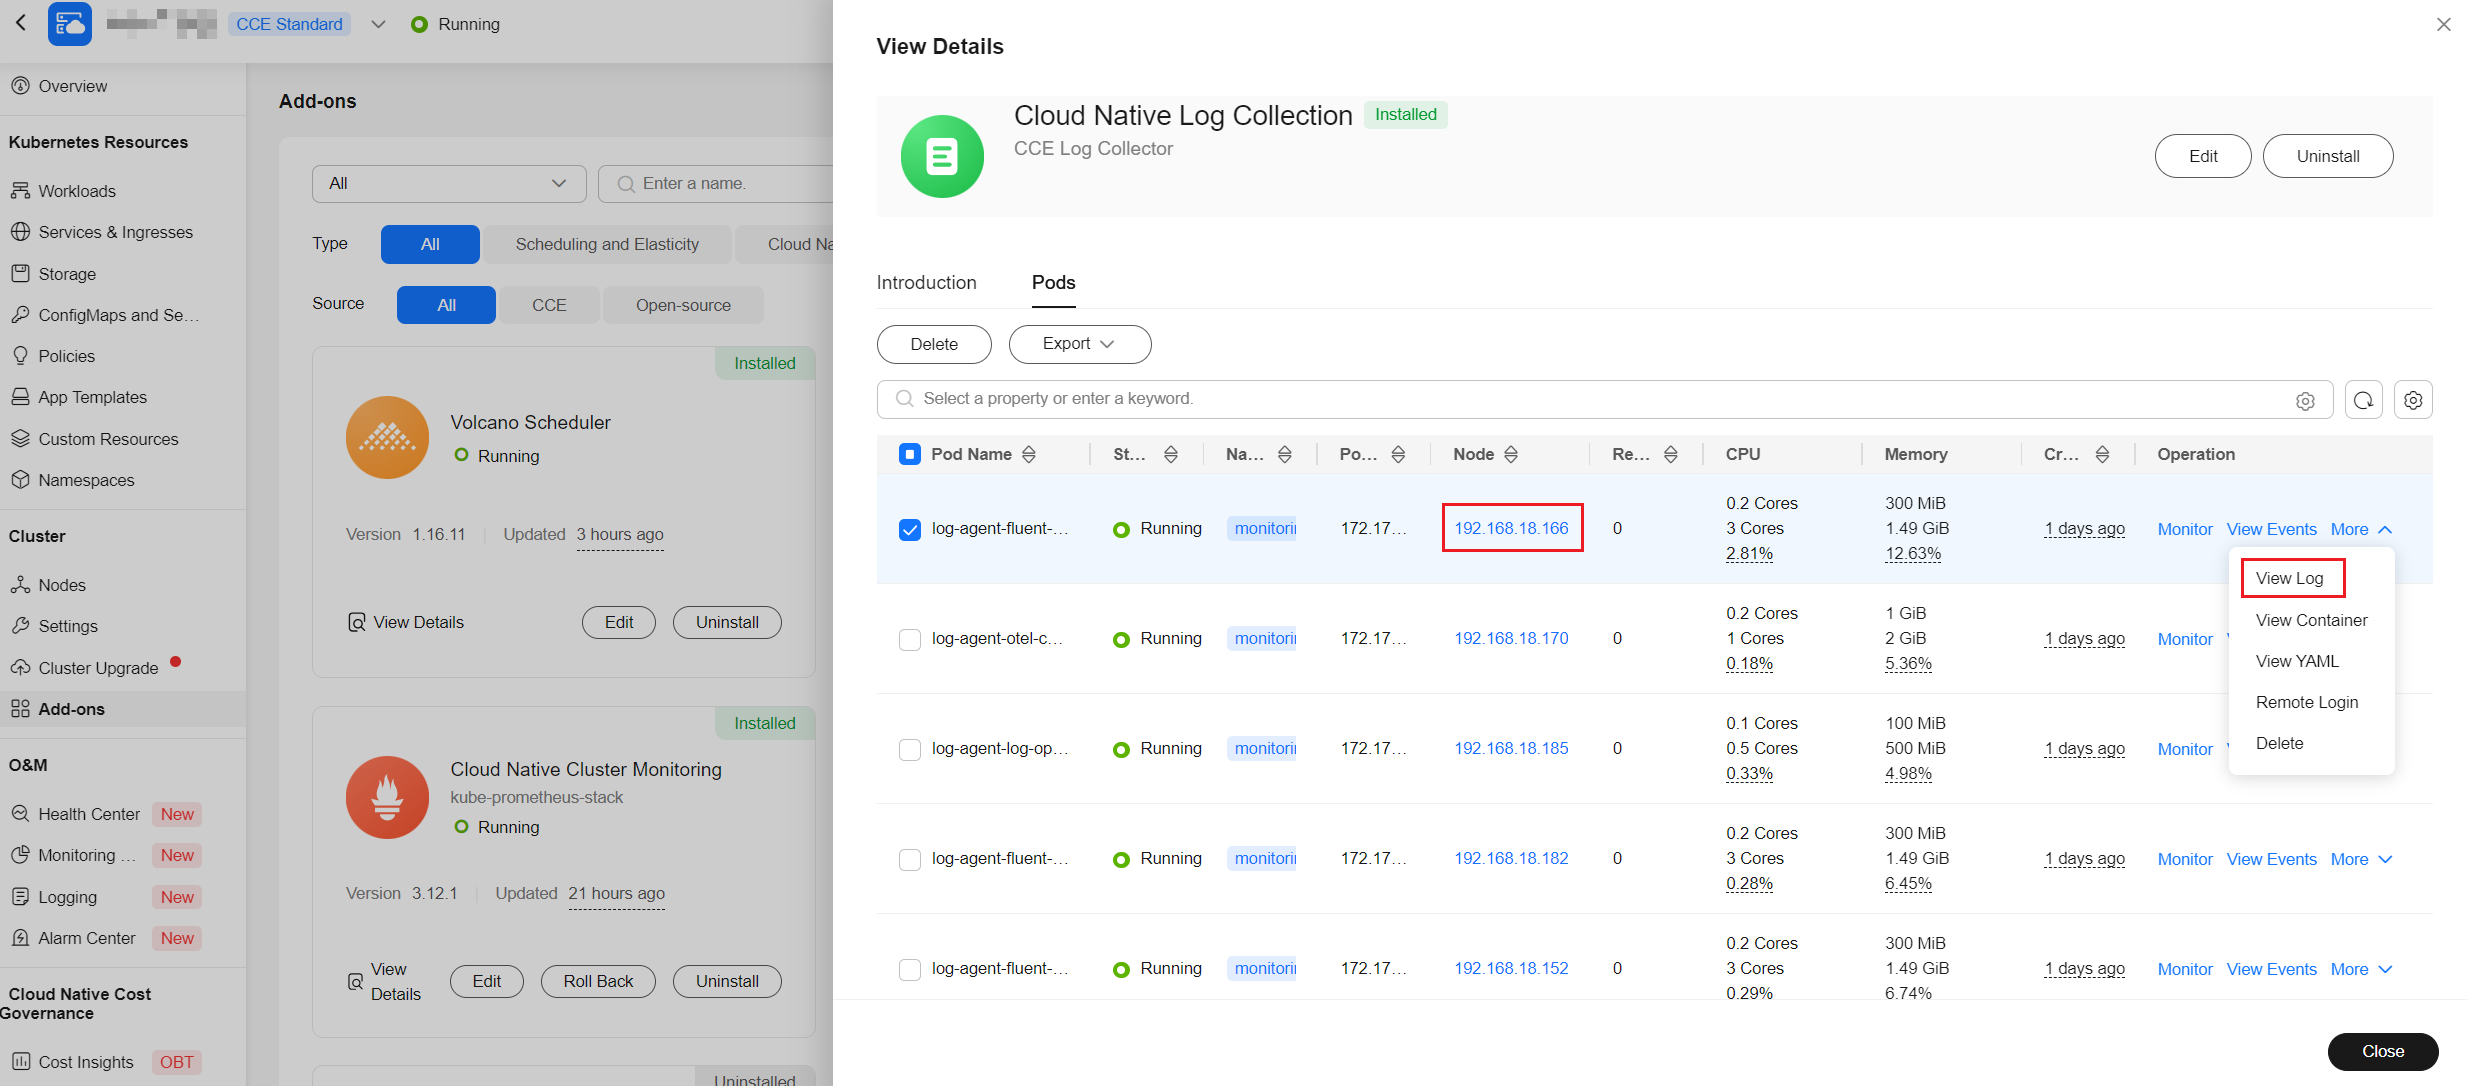
- If the log collection policy of the other type does not take effect and the add-on version is later than 1.5.0, check the log of log-agent-fluent-bit on the node where the container to be monitored is running.
Go to the Add-ons page and click Cloud Native Log Collection. Then, click the Pods tab, locate log-agent-fluent-bit, and choose More > View Log in the Operation column.
Figure 8 Viewing the log of log-agent-fluent-bit
Select the fluent-bit container, search for the keyword "fail to push {event/log} data via lts exporter" in the log, and view the error message.
Figure 9 Viewing the log of the fluent-bit container
- If the error message "The log streamId does not exist." is displayed, the log group or log stream does not exist. In this case, choose Logging > View Log Policy, edit or delete the log collection policy, and recreate a log collection policy to update the log group or log stream.
- For other errors, go to LTS to search for the error code and view the cause.
How Do I Handle OOM on log-agent-otel-collector?
Troubleshooting:
- View the stdout of the log-agent-otel-collector component to check whether errors occur recently.
kubectl logs -n monitoring log-agent-otel-collector-xxx
If an error is reported, handle the error first and ensure that logs can be collected normally.
- If no error is reported recently and OOM still occurs, perform the following steps:
- Go to Logging, click the Global Log Query tab, and click Expanded Log Statistics Chart to view the log statistics chart. If the reported log group and log stream are not the default ones, click the Global Log Query tab and select the reported log group and log stream. Figure 10 Viewing log statistics

- Calculate the number of logs reported per second based on the bar chart in the statistics chart and check whether the number of logs exceeds the log collection performance specification.
If the number of logs exceeds the log collection performance specification, you can increase the number of log-agent-otel-collector copies or increase the memory upper limit of log-agent-otel-collector.
- If the CPU usage exceeds 90%, increase the CPU upper limit of log-agent-otel-collector.
- Go to Logging, click the Global Log Query tab, and click Expanded Log Statistics Chart to view the log statistics chart. If the reported log group and log stream are not the default ones, click the Global Log Query tab and select the reported log group and log stream.
What Can I Do If Some Pod Information Is Missing During Log Collection Due to Excessive Node Load?
When the Cloud Native Log Collection add-on version is later than 1.5.0, some pod information, such as the pod ID and name, is missing from container file logs or stdout logs.
Troubleshooting:
Go to the Add-ons page and click Cloud Native Log Collection. Then, click the Pods tab, locate log-agent-fluent-bit, and choose More > View Log in the Operation column.

Select the fluent-bit container and search for the keyword "cannot increase buffer: current=512000 requested=*** max=512000" in the log.

Solution:
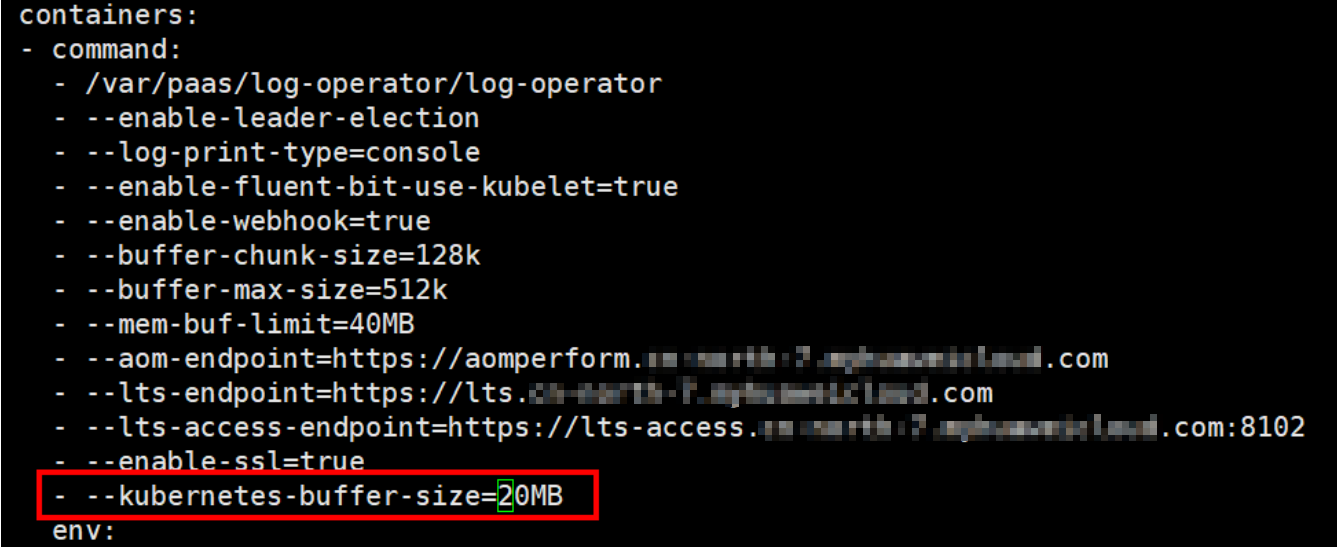
Run the kubectl edit deploy -n monitoring log-agent-log-operator command on the node and add --kubernetes-buffer-size=20MB to the command lines of the log-operator container. The default value is 16MB. You can estimate the value based on the total size of pod information on the node. 0 indicates no limits.

If the Cloud Native Log Collection add-on is upgraded, you need to reconfigure kubernetes-buffer-size.

How Do I Change the Log Storage Period on Logging?
- Log in to the CCE console and choose Clusters. On the displayed page, hover the cursor over the cluster name to view the current cluster ID.Figure 14 Viewing the cluster ID

- Log in to the LTS console. Then, query the log group and log stream by cluster ID.Figure 15 Querying the log group

- Locate the log group and click Modify to configure the log storage period.

The log retention period affects log storage expenditures.
Figure 16 Changing the log retention period
What Can I Do If the Log Group or Stream Specified in the Log Collection Policy Does Not Exist?
- Scenario 1: The default log group or stream does not exist.
Take Kubernetes events as an example. If the default log group or stream does not exist, a message will be displayed on the Kubernetes events page of the console. You can click the button for creating a default log group or stream.
After the log group or stream is created, the ID of the default log group or stream changes, and the existing log collection policy of the default log group or stream does not take effect. In this case, you can rectify the fault by referring to Scenario 2.
Figure 17 Creating a default log group or stream
- Scenario 2: The default log group or stream exists but is inconsistent with that specified in the log collection policy.
- The log collection policy, for example, default-stdout, can be modified as follows:
- Log in to the CCE console and click the cluster name to access the cluster console. In the navigation pane, choose Logging.
- In the upper right corner, click View Log Policy. Then, locate the log collection policy and click Edit in the Operation column.
- Select Custom log group/log stream and configure the default log group or stream.
Figure 18 Configuring the default log group or stream
- If a log collection policy cannot be modified, for example, default-event, you need to re-create a log collection policy as follows:
- Log in to the CCE console and click the cluster name to access the cluster console. In the navigation pane, choose Logging.
- In the upper right corner, click View Log Policy. Then, locate the log collection policy and click Delete in the Operation column.
- Click Create Log Collection Policy. Then, select Kubernetes events in Policy Template and click OK.
- The log collection policy, for example, default-stdout, can be modified as follows:
- Scenario 3: The custom log group (stream) does not exist.
CCE does not support the creation of non-default log groups (streams). You can create a non-default log group (stream) on the LTS console.
After the creation is complete, take the following steps:
- Log in to the CCE console and click the cluster name to access the cluster console. In the navigation pane, choose Logging.
- In the upper right corner, click View Log Policy. Then, locate the log collection policy and click Edit in the Operation column.
- Select Custom log group/log stream and configure a log group or stream.
Figure 19 Configuring a log group or stream
What Can I Do If Logs Cannot Be Collected After Pods Are Scheduled to CCI?
After workloads are scheduled to CCI by using a profile, logs cannot be collected, but the collection policies work on the CCE console.
Check whether the version of the CCE Cloud Bursting Engine for CCI add-on is earlier than 1.3.54. If the version is earlier than 1.3.54, upgrade the add-on.
What Can I Do If FailedAssignENI Is Generated When a Node Is Created in a CCE Turbo Cluster?
If the log add-on has been installed in a CCE Turbo cluster and is running normally, when a node is created, the log-agent-fluent component on the node may report the FailedAssignENI alarm because the network interface of the new node is not ready. The alarm will not be reported again after 5 seconds. The log collection function is not affected.
Feedback
Was this page helpful?
Provide feedbackThank you very much for your feedback. We will continue working to improve the documentation.See the reply and handling status in My Cloud VOC.
For any further questions, feel free to contact us through the chatbot.
Chatbot


