Node Monitoring
To monitor the resource usage of nodes, choose Monitoring Center > Nodes. This tab provides information about all nodes in a cluster and monitoring data of a single node, such as CPU and memory usages, network inbound and outbound rates, and disk I/O read and write rates.
Navigation Path
- Log in to the CCE console and click the cluster name to access the cluster console.
- In the navigation pane, choose Monitoring Center. Then, click the Nodes tab.
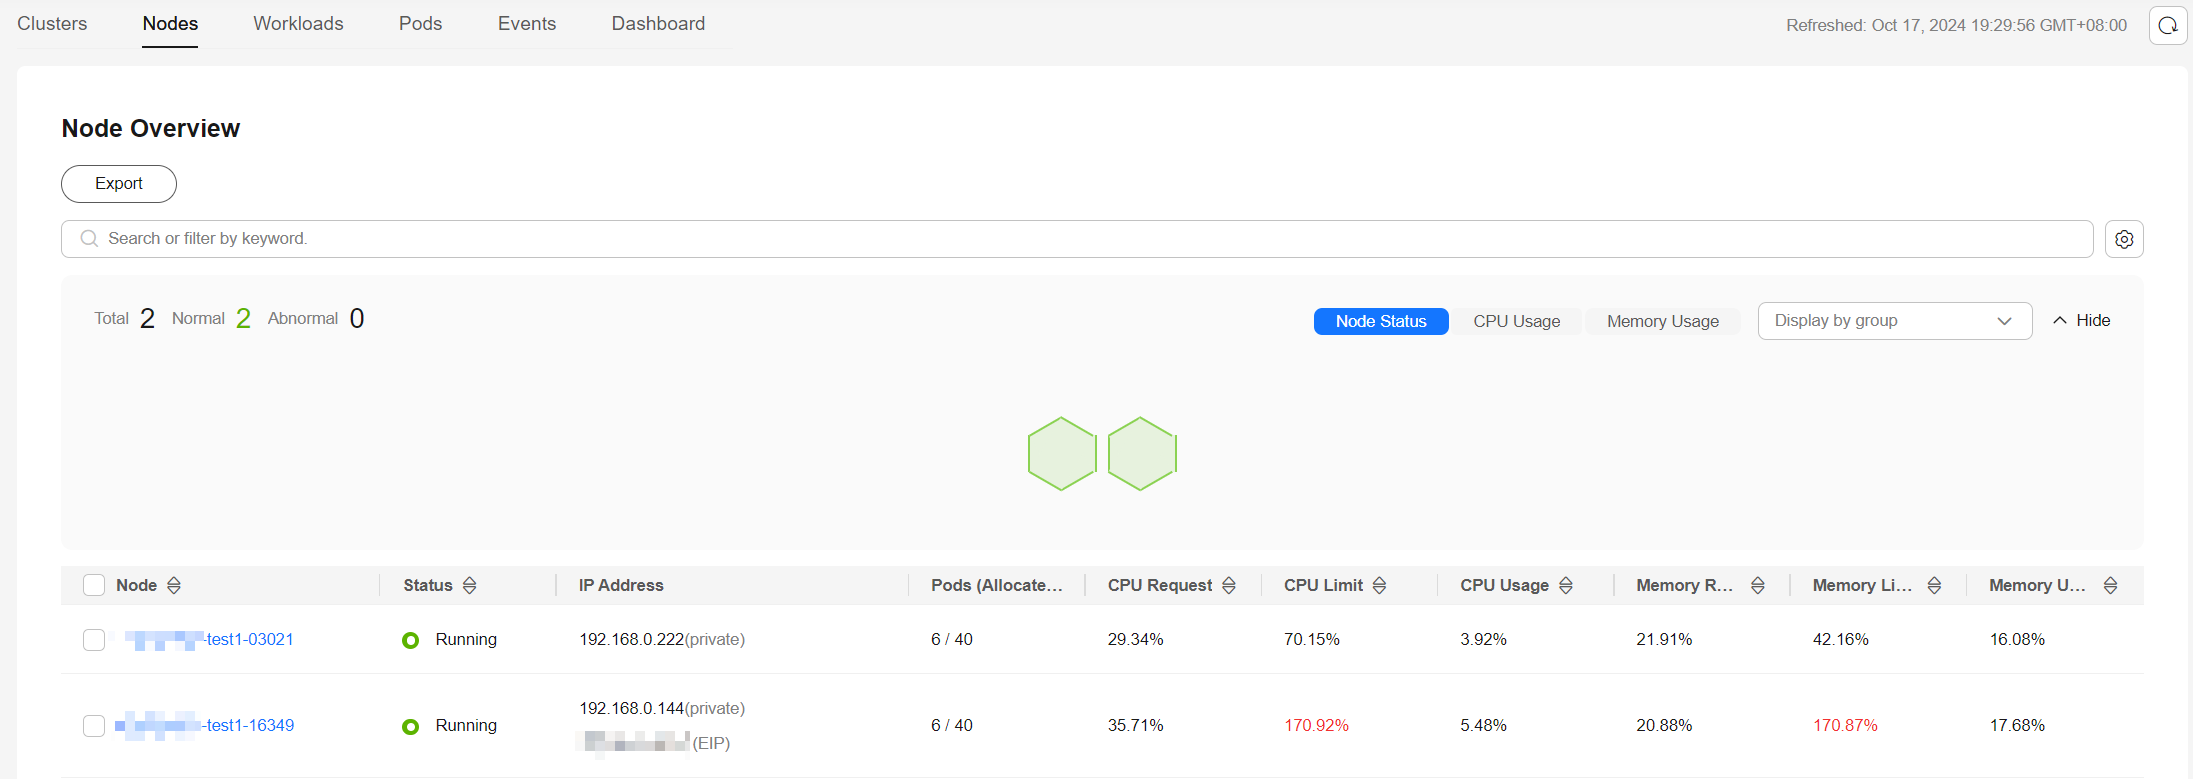
Nodes displays information about all nodes. To view the monitoring information of a node, click the node name to access the Overview tab and switch to the Pods and Monitoring tabs as needed.
Nodes
This tab displays the name, status, IP address, number of pods (allocated/total), CPU request/limit/usage, and memory request/limit/usage of each node.

You can search for the desired node by name, status, private IP address, or public IP address. You can click Export to export data of all nodes or selected nodes. The exported file is in .xlsx format, and the file name contains the timestamp.
If the CPU limit or memory limit of a node exceeds 100%, the node resources are overcommitted and the sum of workload limits (maximum available values) of the node exceeds the node specifications. If workloads require too many resources, they may preempt resources, causing service exceptions or even node exceptions.
Overview

- Resource Overview: displays the node status, the number of pods, and abnormal events.
- Node Monitoring: displays the monitoring overview of the last hour, including the CPU usage, memory usage, and network inbound and outbound rates.
- Pod Usage Trend: displays the resource metrics of each pod on the node. It also displays the top 5 data in descending or ascending order.
For more metrics, go to the Monitoring tab.
Pods
This tab displays the name, status, namespace, IP address, node, number of restarts, and resource metrics of each pod.

You can search for the desired pod by name, status, namespace, IP address, or node. You can click Export to export data of all pods or selected pods. The exported file is in .xlsx format, and the file name contains the timestamp.
You can click the name of a pod to view its monitoring data. For more information, see Pod Monitoring.
Monitoring
This tab displays the resource usage of the node in each dimension in the last 1 hour, last 8 hours, last 24 hours, or a custom period. To view more monitoring information, click View Dashboard to access Dashboard. For details, see Using Dashboard.

- CPU Metrics
- CPU usage: the average percentage of the time that the node CPU is not in an idle state
- CPU allocation ratio: CPU cores requested by all containers on the node/Total CPU cores on the node × 100%
- Single CPU core usage: the percentage of the time that each node CPU core is not in an idle state
- Memory Metrics
- Memory usage: The memory used by the node/Total memory of the node × 100%
- Memory allocation ratio: The memory requested by all containers on the node/Total memory of the node × 100%
- Networking Metrics
- Outbound rate: the number of bytes sent by the network interface on the node per second during different time periods
- Inbound rate: the number of bytes received by the network interface on the node per second during different time periods
- Packet loss (transmit): The packets not received by the receiver/The packets sent from the network interface of the node × 100%
- Packet loss (receive): The packets not received by the network interface of the node/The packets sent to the network interface × 100%
- Disk Metrics
- Disk read rate: the number of bytes read from each file system on the node per second during different time periods.
- Disk write rate: the number of bytes written to each file system on the node per second during different time periods.
- Disk usage: the percentage of used disk space of each file system on the node during different time periods.
- Pod Metrics
- Pod CPU usage: The CPU cores used by each pod on the node during different time periods/The CPU limit of each pod × 100%
- Pod working set usage: The working sets used by each pod on the node during different time periods/The memory limit of each pod × 100%
- Pod physical memory usage: The physical memory used by each pod on the node during different time periods/The memory limit of each pod × 100%
- Pod status and quantity: the total number of pods in the Unavailable, Unready, Running, Completed, or Other state on the node during different time periods
- Pod quantity trend: the number of pods on the node during different time periods
- Other Metrics
- Average node load: the average number of running processes on the node in a specified period. This metric is used to check whether the number of processes running on the node reaches its processing capability. Generally, it should be kept within a reasonable range for stability and reliability of the node.
- iptables connections: the maximum number of entries and the number of allocated entries in the connection tracking table
Feedback
Was this page helpful?
Provide feedbackThank you very much for your feedback. We will continue working to improve the documentation.See the reply and handling status in My Cloud VOC.
For any further questions, feel free to contact us through the chatbot.
Chatbot


