Kubernetes Dashboard
Introduction
Kubernetes Dashboard is a general purpose, web-based UI for Kubernetes clusters. It allows users to manage applications running in the cluster and troubleshoot them, as well as manage the cluster itself, by running commands.
With Kubernetes Dashboard, you can:
- Deploy containerized applications to a Kubernetes cluster.
- Diagnose containerized application problems.
- Manage cluster resources.
- View applications running in a cluster.
- Create and modify Kubernetes resources (such as Deployments, jobs, and DaemonSets).
- Check errors that occur in a cluster.
For example, you can scale a Deployment, perform a rolling update, restart a pod, or deploy a new application.
Open-source community: https://github.com/kubernetes/dashboard
Installing the Add-on
- Log in to the CCE console and click the cluster name to access the cluster console. In the navigation pane, choose Add-ons, locate Kubernetes Dashboard on the right, and click Install.
- (Supported by 3.0.2 and later versions) In the window that slides out from the right, configure Specifications.
Table 1 Add-on configuration Parameter
Description
Add-on Specifications
Select Preset or Custom for the add-on specifications.
Containers
If you selected Custom, you can adjust the container specifications as needed.
- In the Parameters area, configure the following parameters:
- Access Mode: NodePort is supported. This add-on can be accessed through the EIP bound to the node. If the cluster node does not have an EIP bound to it, then this function will not be available.
- Certificate: Configure a certificate for the dashboard.
- Use a custom certification.
You need to fill in the Certificate File and Certificate Private Key in PEM format by referring to the example.
- Use the default certificate.

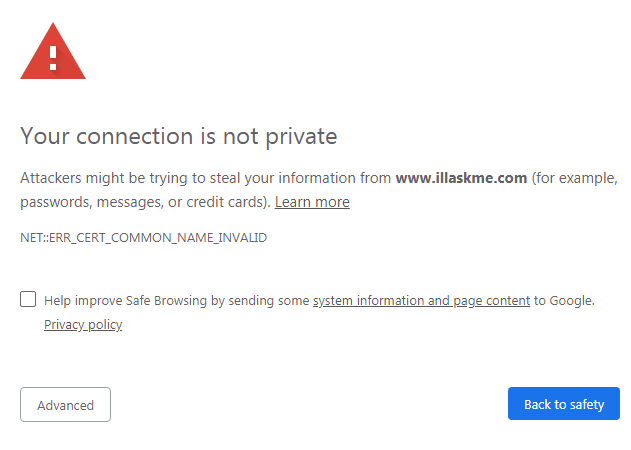
The default certificate generated by the dashboard is invalid, which affects the normal access to the dashboard through a browser. You are advised to manually upload a valid certificate so that the browser can verify your access and secure your connection.
- Use a custom certification.
- Click Install.
Accessing the dashboard Add-on
- Log in to the CCE console and click the cluster name to access the cluster console. Choose Add-ons in the navigation pane. On the page displayed, verify that the dashboard add-on is in the Running state and click Access.
- Copy the token in the dialog box displayed.
- On the dashboard login page, select Token, paste the copied token, and click SIGN IN.

By default, this add-on does not support login using kubeconfig authenticated by certificate. You are advised to use the token mode for login. For details, see https://github.com/kubernetes/dashboard/issues/2474#issuecomment-348912376.
Modifying Permissions
After the dashboard is installed, the initial role can only view a majority of resources that are displayed on the dashboard. To apply for the permissions to perform other operations on the dashboard, modify RBAC authorization resources in the background.
Procedure
Modify the kubernetes-dashboard-minimal rule in the ClusterRole.
For details about how to use RBAC authorization, visit https://kubernetes.io/docs/reference/access-authn-authz/rbac/.
Components
|
Component |
Description |
Resource Type |
|---|---|---|
|
Dashboard |
Visualized monitoring UI |
Deployment |
|
Component |
Description |
Resource Type |
|---|---|---|
|
dashboard-api |
Back-end API of Dashboard, which provides a RESTful API for communicating with the Kubernetes API server. This component obtains cluster information from the Kubernetes API server and reports the information to the web component. |
Deployment |
|
dashboard-auth |
Authentication module of Dashboard, which provides a token-based authentication mechanism. When a user logs in to the Dashboard, this component checks whether the token provided by the user is valid. If the token is valid, the user can access the Dashboard. |
Deployment |
|
dashboard-web |
Front-end UI of Dashboard, which provides a user-friendly UI for viewing and managing Kubernetes clusters. This component is a single-page application based on the React framework and can be accessed through HTTPS. |
Deployment |
|
metrics-scraper |
Metric collection module of Dashboard, which collects metric data from Kubernetes clusters and reports the data to the web component. Metrics-scraper uses Heapster or Metrics Server to get metric data, and it stores the data in the Kubernetes API server. |
Deployment |
|
dashboard-kong |
Open-source API gateway component on which Dashboard depends, which helps manage APIs and implement authentication and authorization. |
Deployment |
Troubleshooting Access Problems

- Solution 1: Use the Firefox browser to access the dashboard. In the Exceptions area of the Proxy Settings page, add the dashboard address to the addresses that will bypass the proxy server. Then, the dashboard login page will be displayed.
- Solution 2: Start Google Chrome with the --ignore-certificate-errors flag to ignore the certificate error.
Windows: Save the dashboard address. Close all active Google Chrome windows. Press the Windows key + R to display the Run dialog box. Enter chrome --ignore-certificate-errors in the Run dialog box to open a new Google Chrome window. In the address bar, enter the dashboard address to open the login page.
Feedback
Was this page helpful?
Provide feedbackThank you very much for your feedback. We will continue working to improve the documentation.See the reply and handling status in My Cloud VOC.
For any further questions, feel free to contact us through the chatbot.
Chatbot


