
Enterprise Report
Enterprise administrators can view solutions, requirements, and issue reports of their own enterprises in enterprise reports and customize efficiency analysis. For details about how to become an enterprise administrator, see Setting an Enterprise Administrator.
Solution Reports
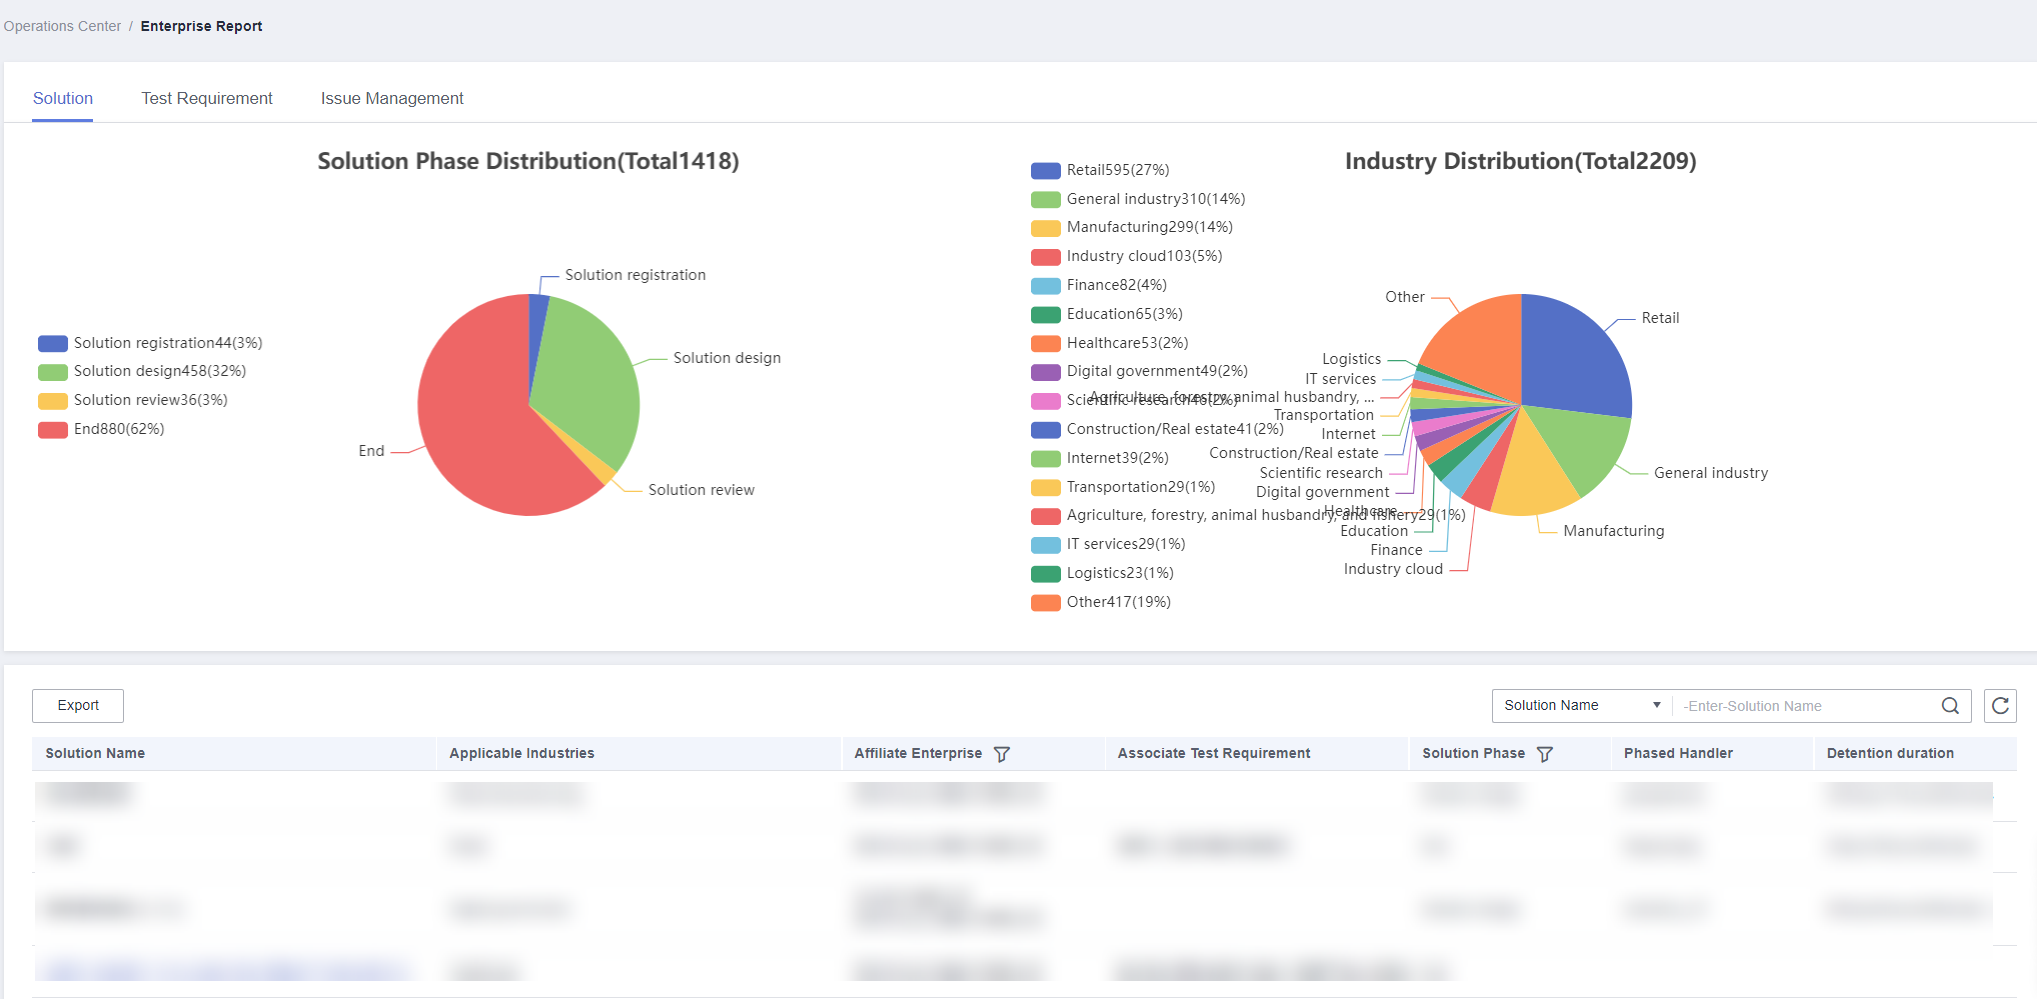
The Solutions page consists of three areas: solution phase distribution pie chart, industry distribution pie chart, and solution list in the workspace. The statistics are derived from all user-built solutions of your enterprise.
- Solution phase distribution pie chart: All solutions of your enterprise are displayed by solution phase. There are four phases: solution registration, solution design, solution review, and design completion.
- Industry distribution pie chart: Solutions are displayed by industry that the solutions in the workspace belong to.
- Solution list: You can view the solution name, applicable industries, associated enterprise, associated test requirement, solution phase, handler, and retention duration. You can search for solutions by solution name and export solutions to an .xlsx file.
Requirement Reports
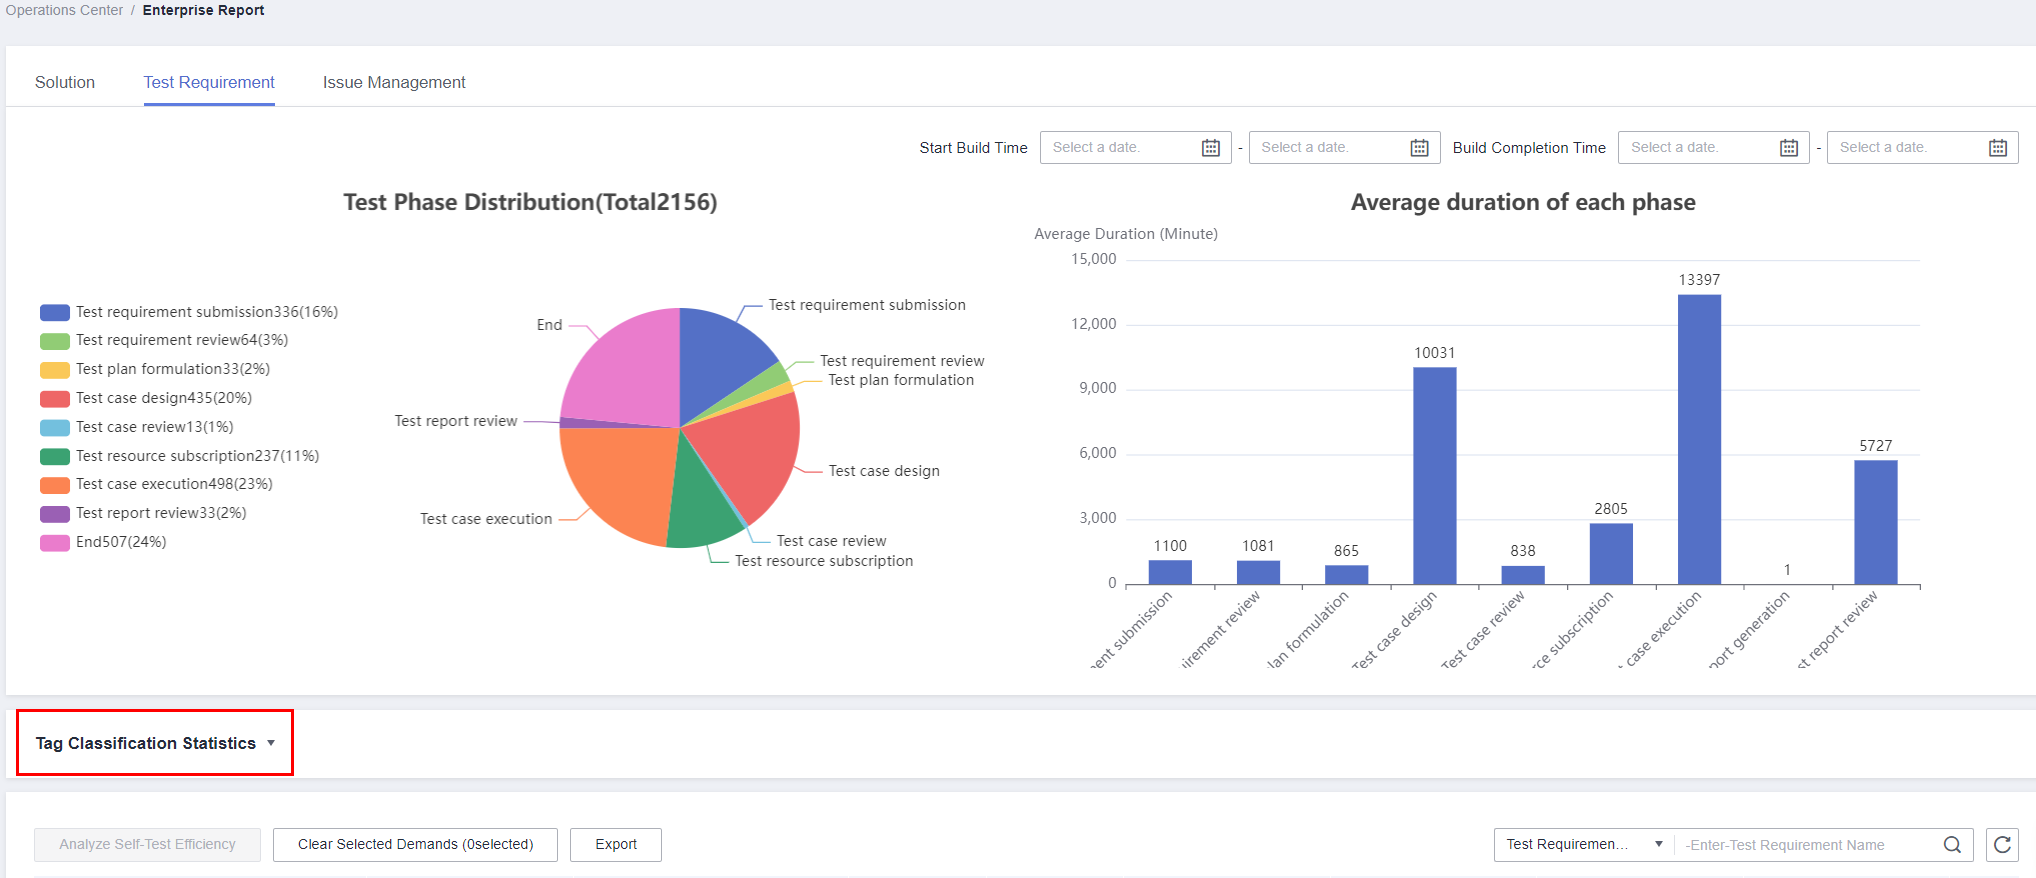
The Test Requirements page consists of three areas: test phase distribution pie chart, average phase duration bar chart, and test requirement list. The statistics are derived from all user-built test requirements of your enterprise.
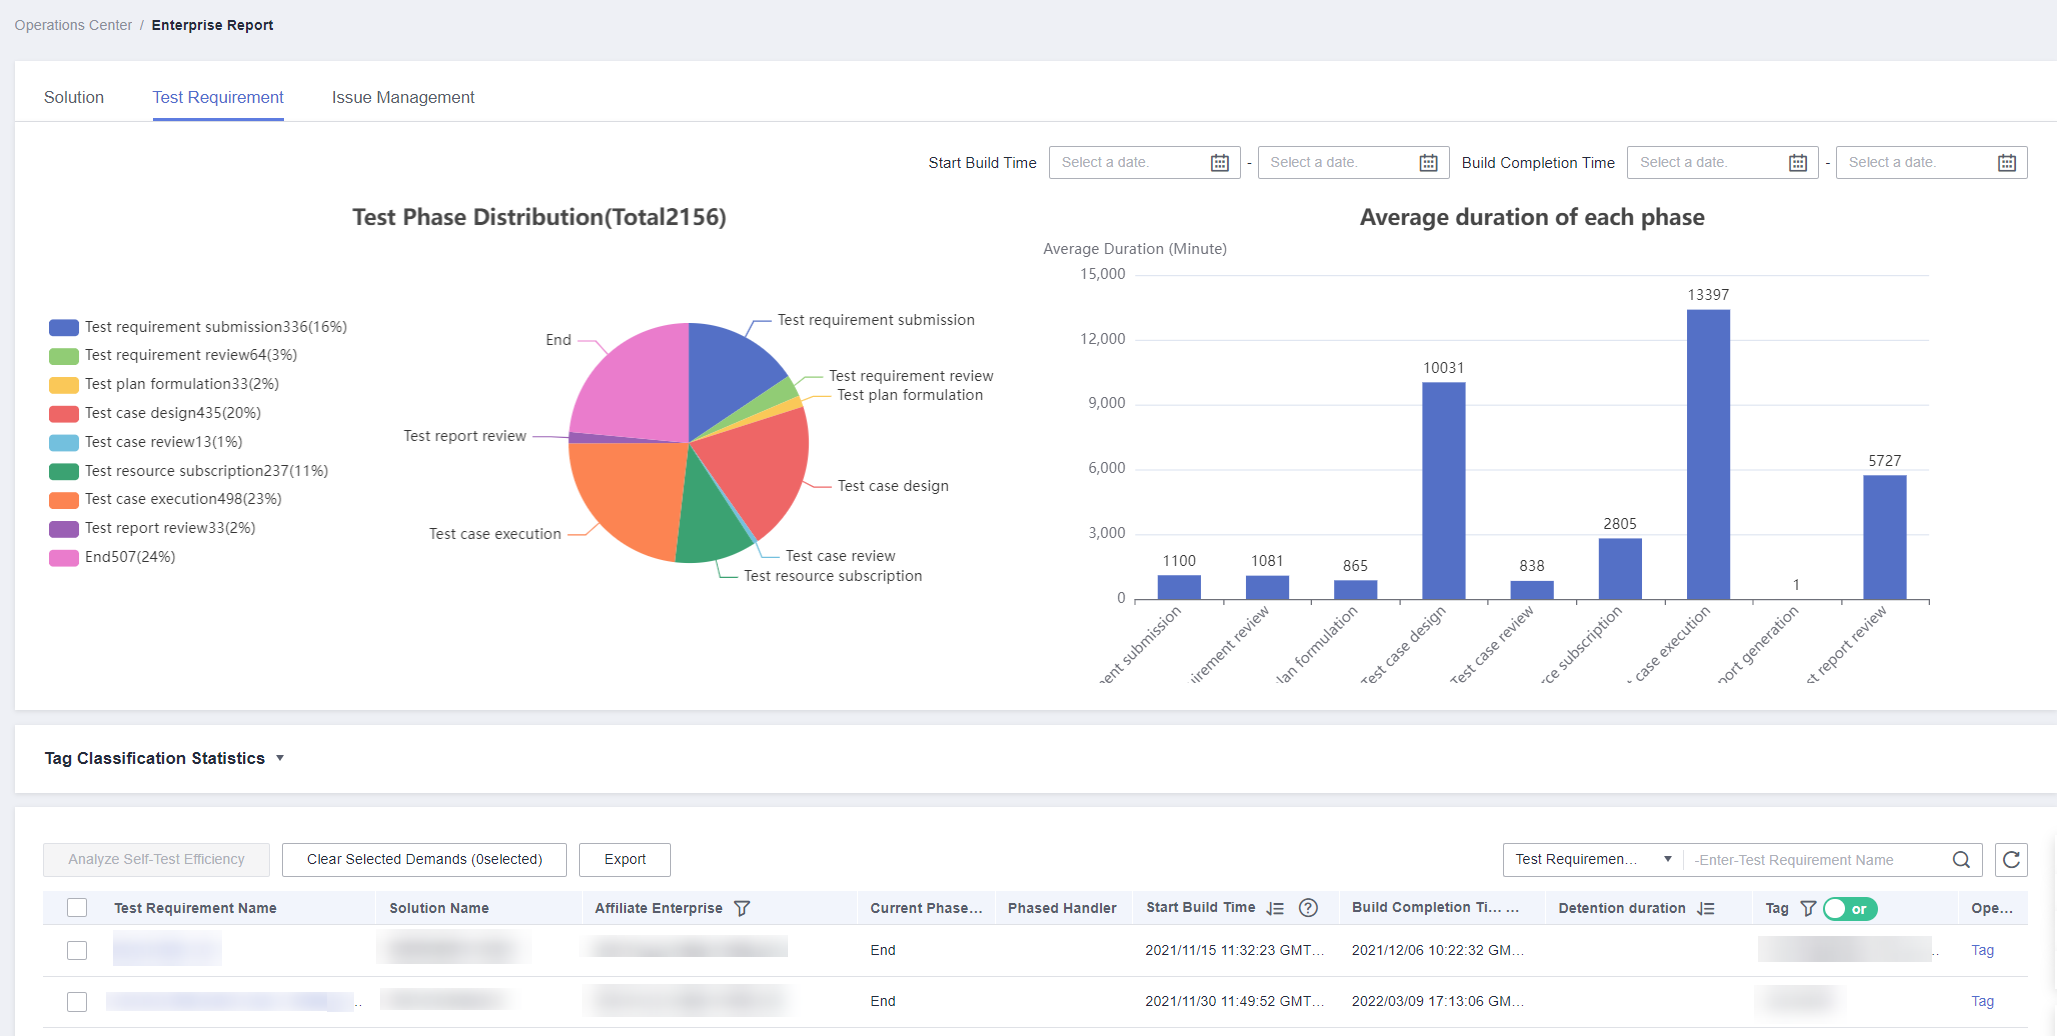
- Test phase distribution pie chart: All test requirements of your enterprise are displayed by test phase. There are nine test phases: test requirement submission, test requirement review, test plan formulation, test case design, test case review, test resource provisioning, test case execution, test report review, and completion.
- Average phase duration bar chart: The average phase duration of all test requirements of your enterprise is displayed. There are nine phases: test requirement submission, test requirement review, test plan formulation, test case design, test case review, test resource provisioning, test case execution, test report generation, and test report review.
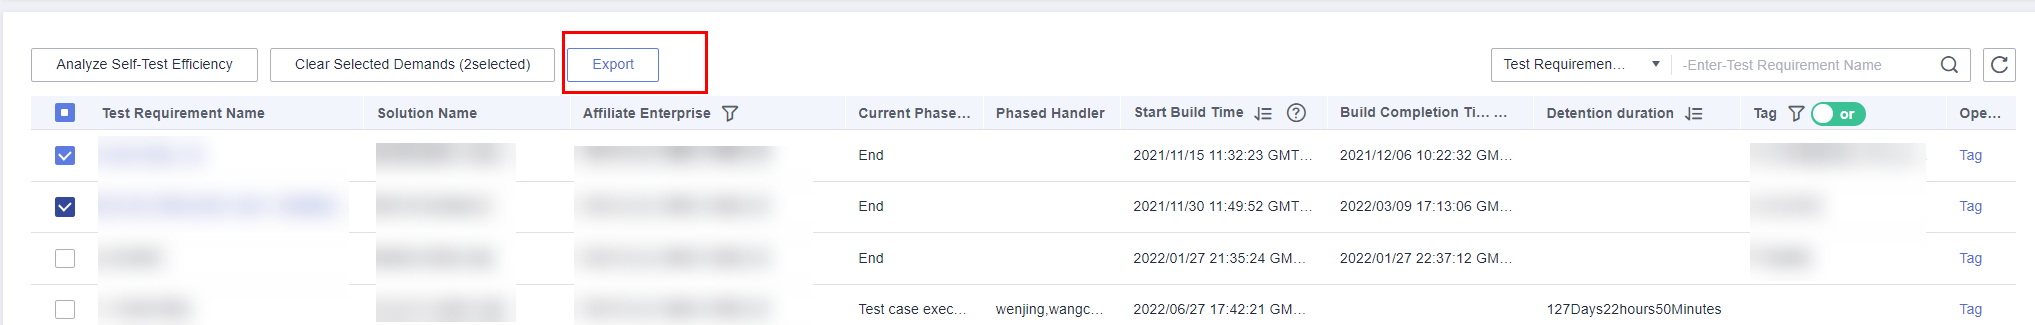
- Test requirement list: You can view information such as the test requirement name and solution name, manage labels for requirement tags, and analyze self-test efficiency.
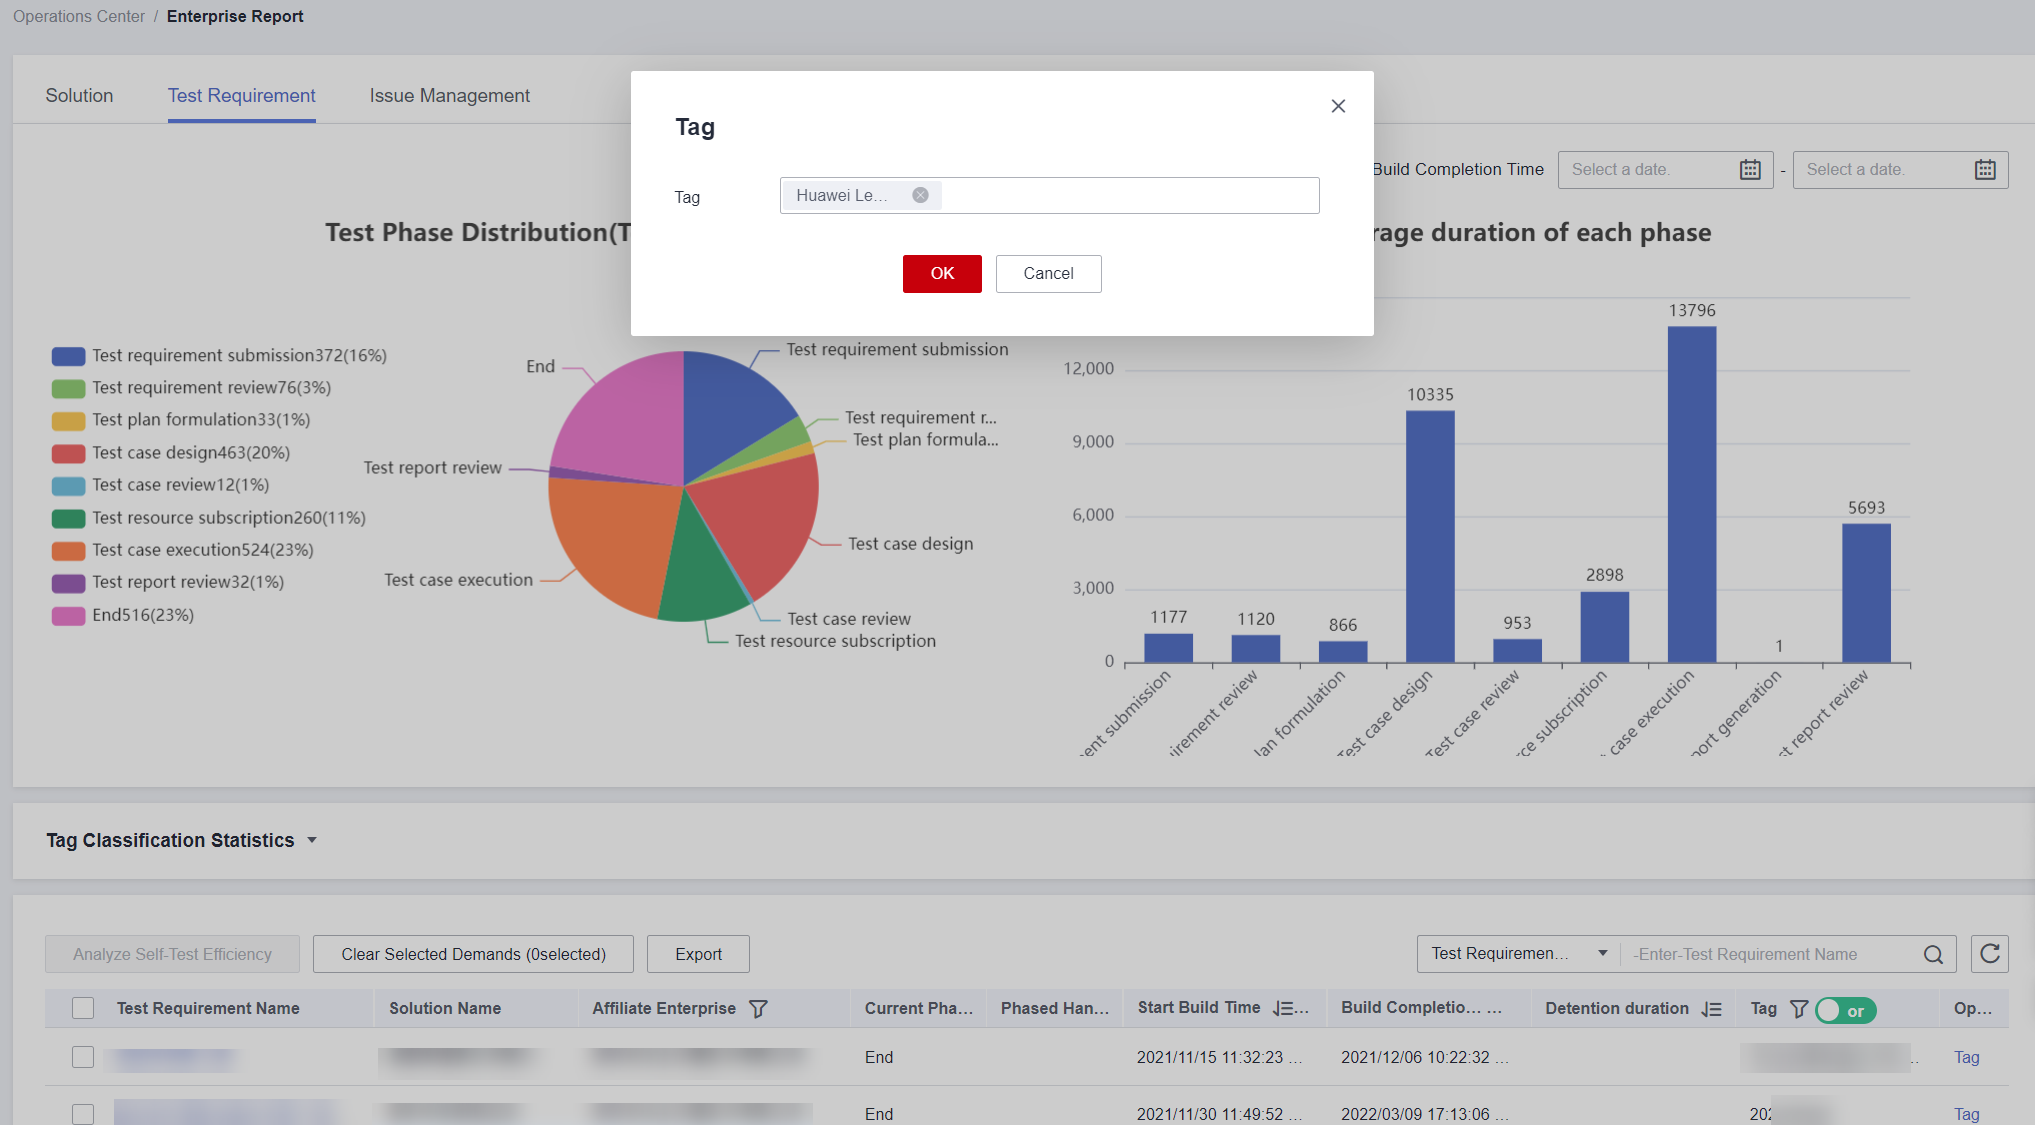
Tagging Test Requirements
Users can tag test requirements and manage them by tag on the Test Requirements page.
Locate the test requirement and click Tag in the Operation column. In the displayed dialog box, enter or select a tag, and click OK. If you need to add, delete, or modify a new tag, click Tag again.
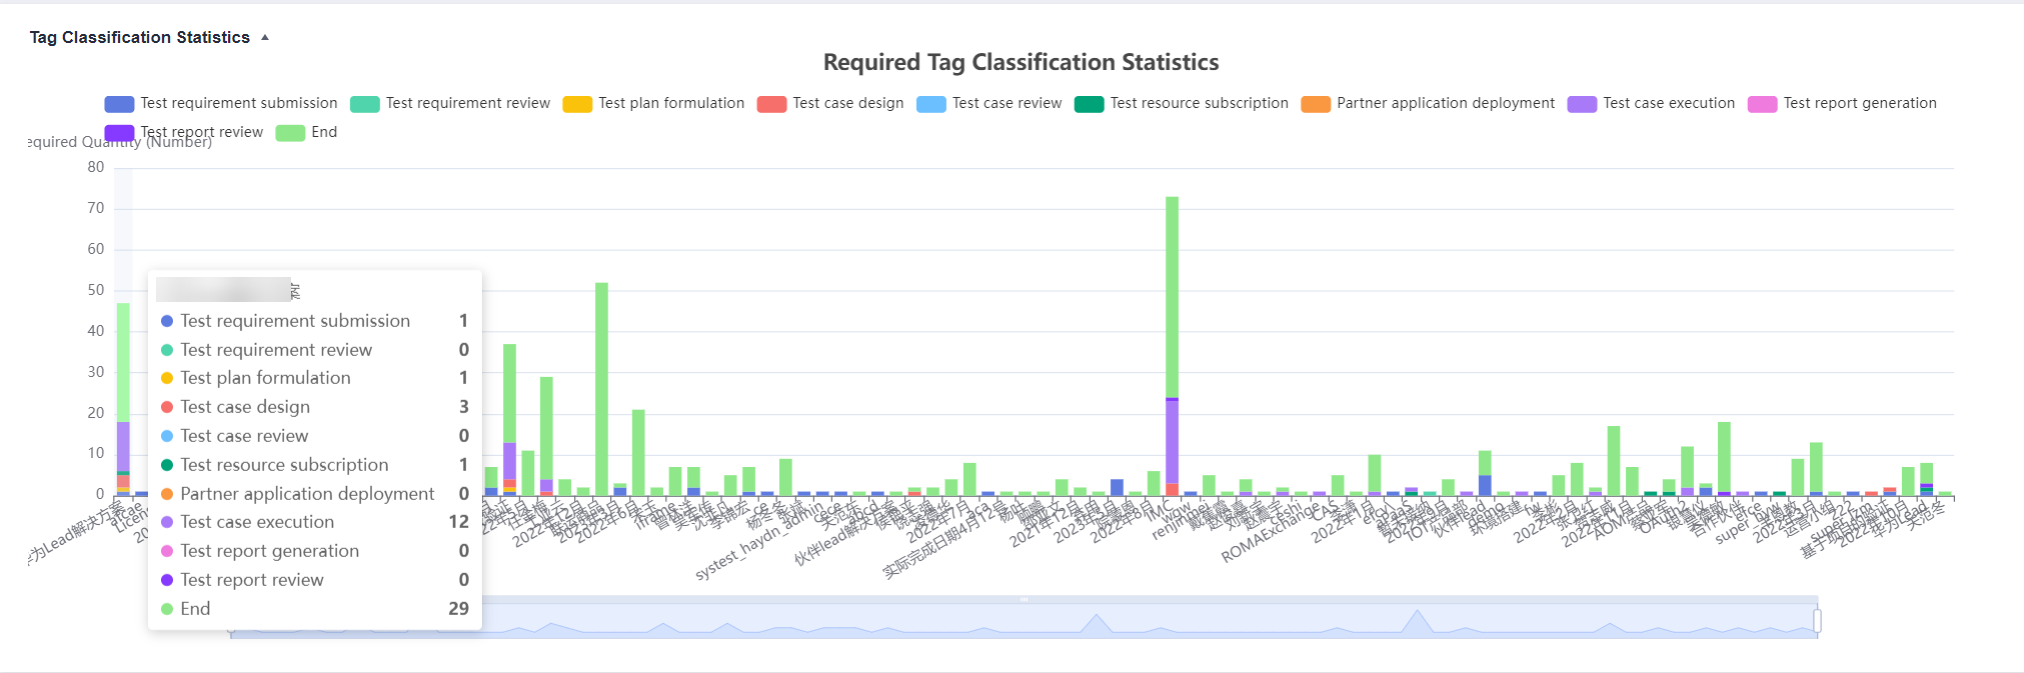
Collecting Statistics by Tag Classification
After tags are created, you can collect statistics on all requirements by tag classification. The following figure shows the entry for Tag Classification Statistics.
You can click Tag Classification Statistics and move the cursor over each bar to view the required quantity and phase distribution of each tag. The horizontal axis represents the tag name and the vertical axis represents the required quantity.
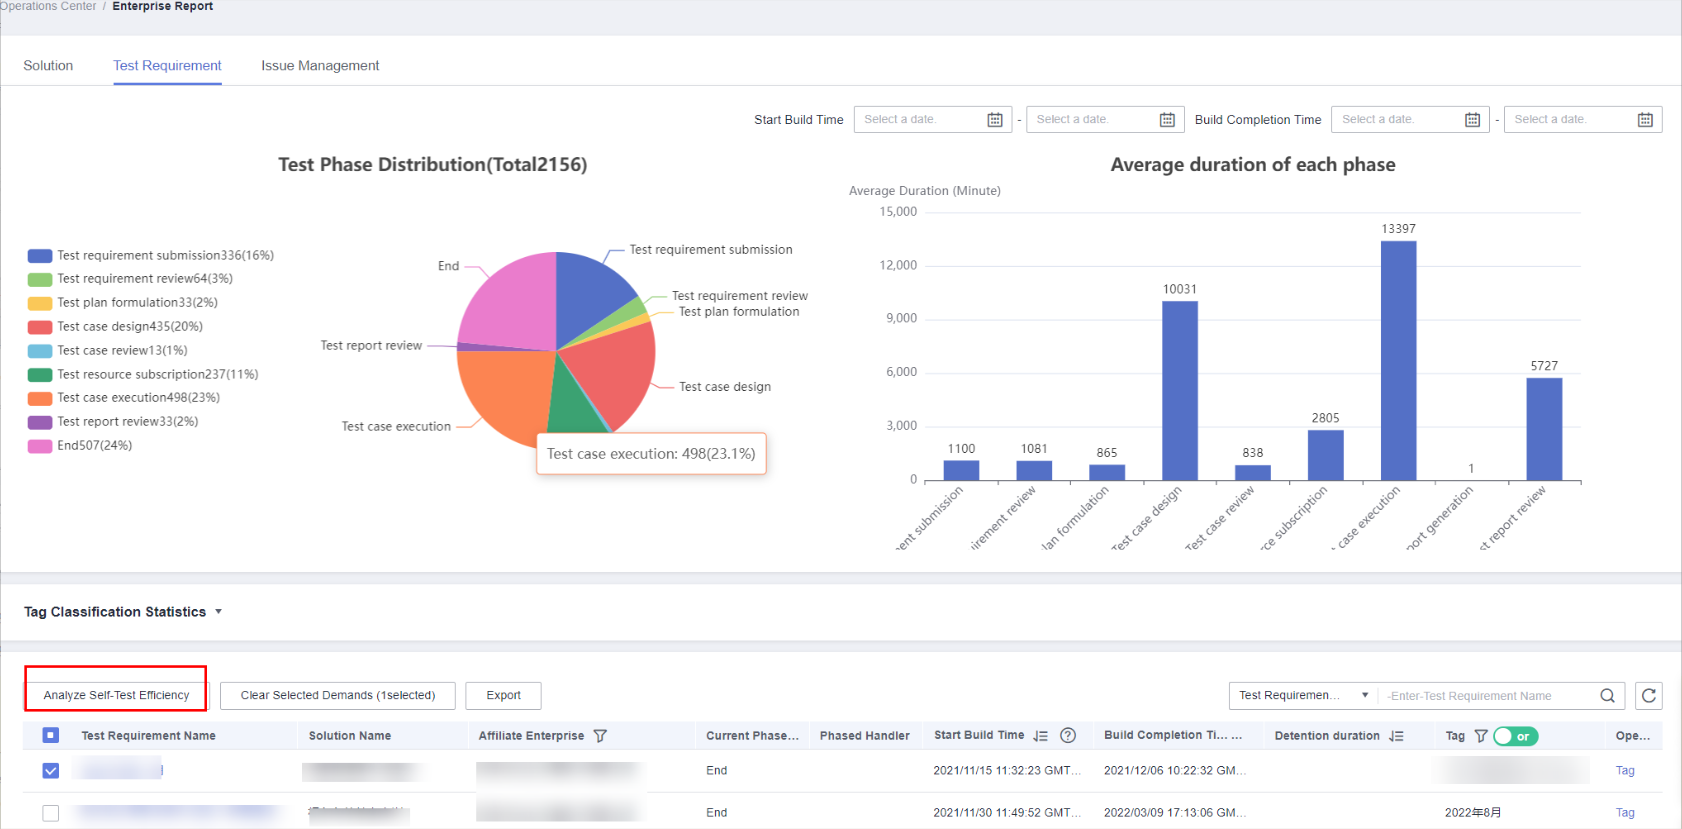
Analyzing Self-Test Efficiency
On the Test Requirements page, you can select the requirements to be analyzed and click Analyze Self-Test Efficiency to view the average solution building duration and average self-test rate.
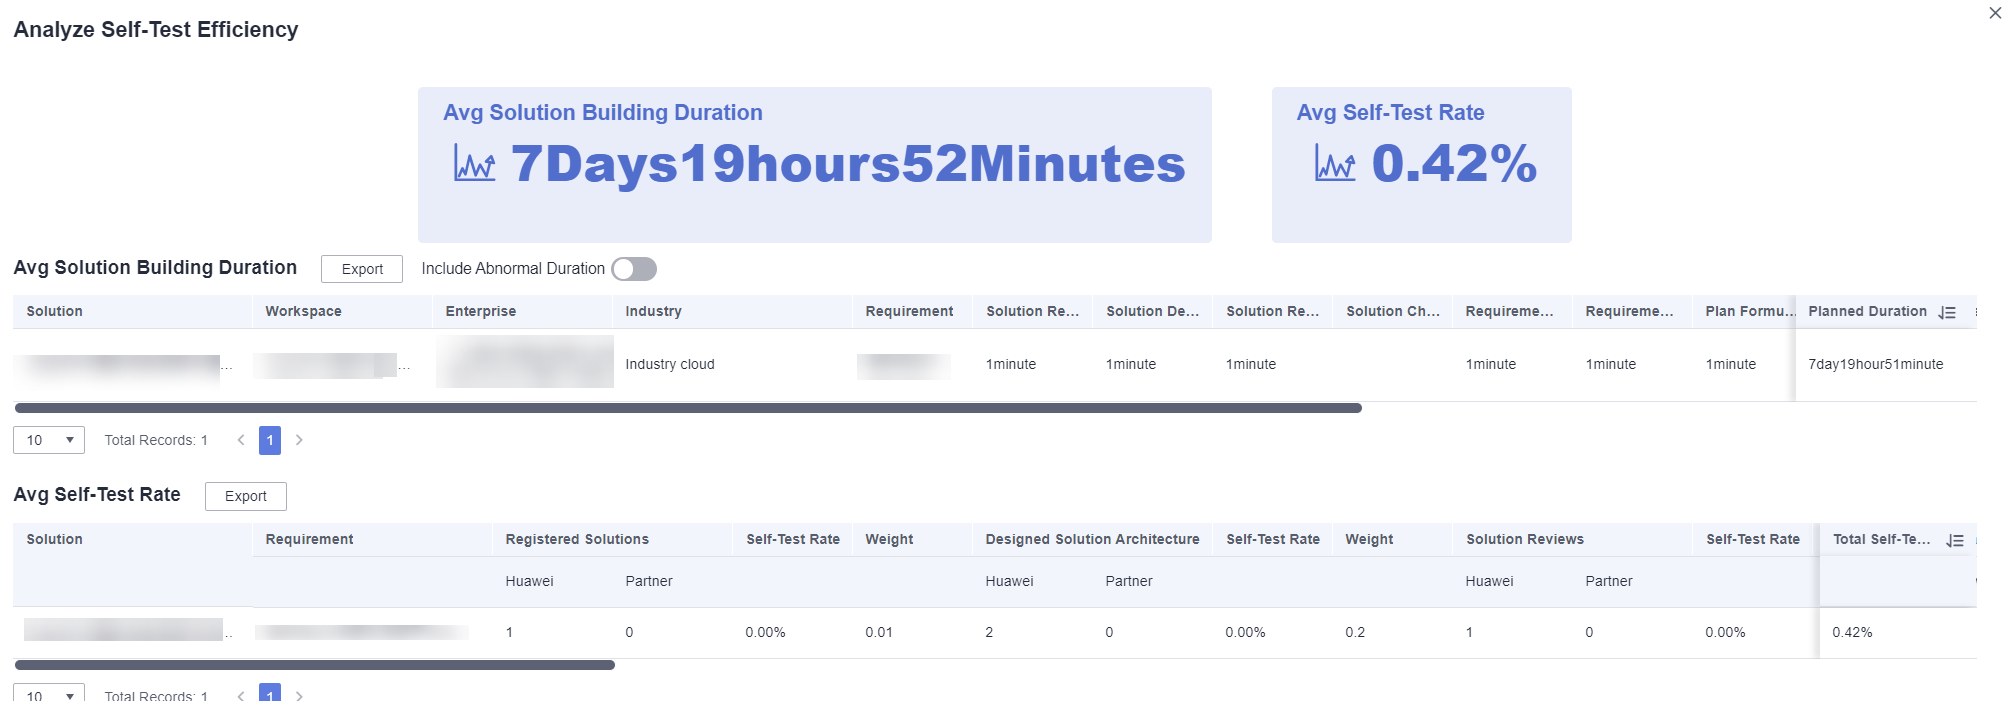
- Avg Solution Building Duration: average building solution of the selected solution.
- Avg Self-Test Rate: average self-test rate of requirements of the selected solution.

The self-test rate is the percentage of registered solutions, designed solutions, or reviewed solutions participated by partners. For example, if the total number of registered solutions is 2 and the number of registered solutions participated by partners is 1, the self-test rate in the solution registration phase is 50% (1/2). The average self-test rate is the value calculated based on the weight of the self-test rate in each phase.
Exporting a Requirement Report
Issue Reports
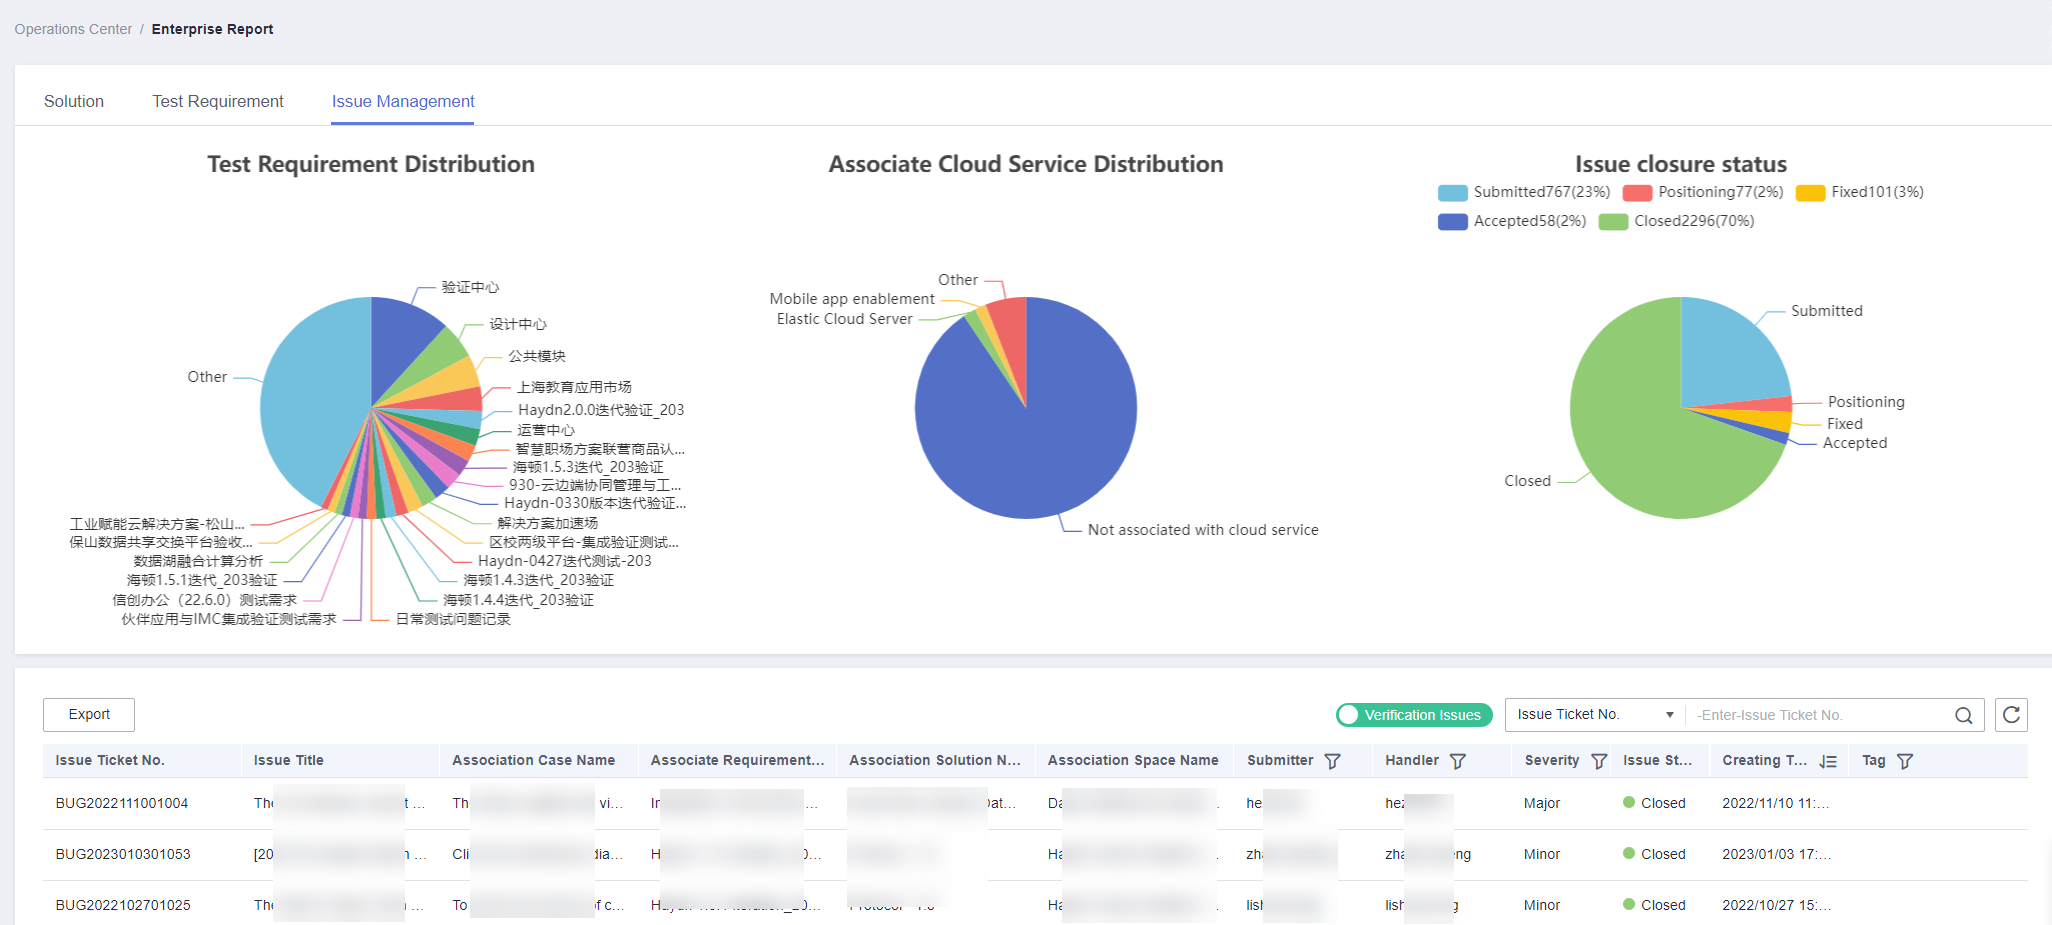
The Issue Management page consists of four areas: test requirement distribution pie chart, associated cloud service distribution pie chart, issue closure status pie chart, and issue list. The statistics are derived from all user-built issue tickets of your enterprise.
- Test requirement distribution pie chart: All the requirements of your enterprise are displayed by issue.
- Associated cloud service distribution pie chart: Issues of your enterprise are displayed by cloud service.
- Issue closure status: Verified issue tickets of your enterprise in the current phase are displayed. There are five phases: submission, locating, rectification, acceptance, and closure.
- Issue list: All issue tickets of your enterprise are displayed. You can view information such as the requirement associated with an issue ticket. You can search for an issue by information such as issue ticket number or issue title.
Feedback
Was this page helpful?
Provide feedbackThank you very much for your feedback. We will continue working to improve the documentation.See the reply and handling status in My Cloud VOC.
For any further questions, feel free to contact us through the chatbot.
Chatbot


