
How Do I Connect a Service Mesh to Jaeger or Zipkin for Viewing Traces?
ASM can export traces to Jaeger or Zipkin. You can view them on the Jaeger or Zipkin UI. The following uses Zipkin as an example.
Prerequisites
The cluster and namespace where Zipkin is to be installed have been specified.
Procedure
- Create a Deployment named zipkin.
Log in to the CCE console and click the cluster name to go to the cluster console. In the navigation pane, choose Workloads. On the Deployments tab, click Create from YAML, and copy the following content to the YAML file:
apiVersion: apps/v1
kind: Deployment
metadata:
  name: zipkin
  namespace: monitoring
spec:
  progressDeadlineSeconds: 600
  replicas: 1
  revisionHistoryLimit: 10
  selector:
    matchLabels:
      app.kubernetes.io/instance: zipkin
      app.kubernetes.io/name: zipkin
  strategy:
    rollingUpdate:
      maxSurge: 25%
      maxUnavailable: 25%
    type: RollingUpdate
  template:
    metadata:
      labels:
        app.kubernetes.io/instance: zipkin
        app.kubernetes.io/name: zipkin
    spec:
      automountServiceAccountToken: false
      containers:
      - env:
        - name: STORAGE_TYPE
          value: mem
        image: openzipkin/zipkin-slim:latest                                  # Community Zipkin image path. Ensure that you can access this path.
        imagePullPolicy: IfNotPresent
        name: zipkin
        readinessProbe:
          failureThreshold: 3
          httpGet:
            path: /health
            port: 9411
            scheme: HTTP
          initialDelaySeconds: 5
          periodSeconds: 5
          successThreshold: 1
          timeoutSeconds: 1
        resources:
          limits:
            cpu: 500m
            memory: 4Gi
          requests:
            cpu: 100m
            memory: 128Mi
        securityContext:
          readOnlyRootFilesystem: true
          runAsNonRoot: true
          runAsUser: 1000
        terminationMessagePath: /dev/termination-log
        terminationMessagePolicy: File
      terminationGracePeriodSeconds: 30
The Deployment named zipkin is displayed on the Deployments tab. If the status of zipkin changes to Running, Zipkin has been installed in the monitoring namespace of the target cluster.

- Create a Service of the LoadBalancer type.
On the cluster console, choose Services & Ingresses in the navigation pane. On the Services tab, click Create Service. Then, configure the parameters as follows:
- Service Name: Enter a name. zipkin is used as an example here.
- Service Type: Select LoadBalancer.
- Selector: Click Reference Workload Label. The label is automatically added.
- Ports: Configure the container port and Service port. 9411 is used as an example here.
Retain the default values for other parameters.

The Service named zipkin is displayed on the Services tab.


If you do not need to access the Zipkin UI, set Access Type to ClusterIP.
- Buy a service mesh and connect it to Zipkin.
Log in to the ASM console and click Buy Mesh. In Cluster Configuration, select the cluster in 1. In Observability Configuration, enable tracing. Then, select Third-party Jaeger/Zipkin service for Version, set Service Address and Access Port, and configure other parameters as required.

- Deploy an experience service () by referring to Grayscale Release Practices of Bookinfo. After the deployment is complete, the details, productpage, ratings, and reviews services are displayed on the Service Management page.
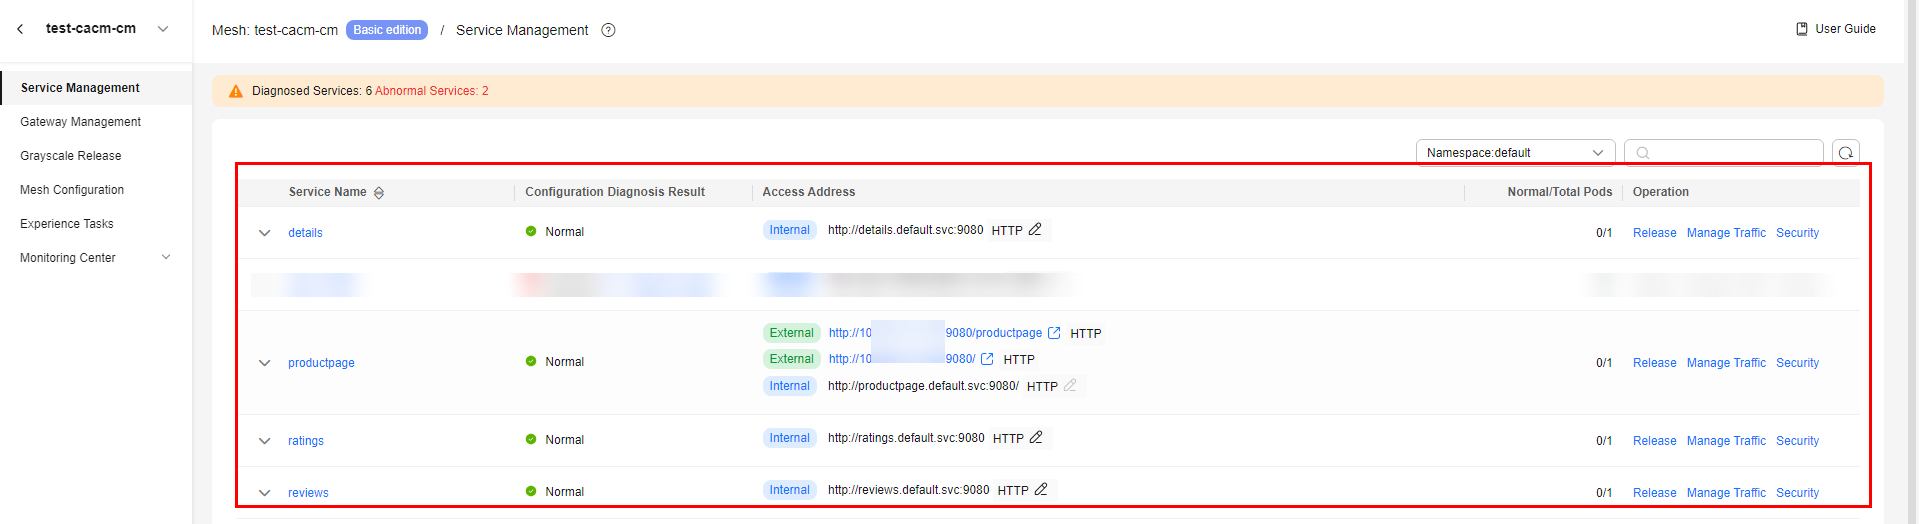
- Access the productpage details page to trigger tracing.
Go to the service mesh details page. In the navigation pane, choose Service Management. On the displayed page, click the external address http://{IP address}:{Port number}/productpage of the productpage service.
- View the traces on the Zipkin UI at http://{Public IP address of the load balancer configured for zipkin}:{Access port of zipkin}/zipkin/.

You can obtain the IP address and port for logging in to the Zipkin client as follows:
- IP address: Go to the console of the cluster where Zipkin is installed. In the navigation pane, choose Services & Ingresses. On the Services tab, view the public IP address of the load balancer configured for zipkin.
- Port: On the Services tab, view the access port of zipkin.
Feedback
Was this page helpful?
Provide feedbackThank you very much for your feedback. We will continue working to improve the documentation.See the reply and handling status in My Cloud VOC.
For any further questions, feel free to contact us through the chatbot.
Chatbot


