
Why Is an otel-collector Workload Created Alongside a Service Mesh?
Symptom
An otel-collector workload is automatically created when a service mesh is created.
Analysis
After a cluster is connected to a service mesh, an otel-collector workload is automatically created in the monitoring namespace to collect telemetry data (traces, logs, and metrics) from Envoy proxies, process the data, and export the data to one or more backends for mesh observability.
otel-collector Architecture

otel-collector consists of four modules:
- Receivers
A receiver, which can be push- or pull-based, is how data gets into otel-collector. Receivers can receive telemetry data in multiple formats, such as OTLP, Jaeger, and Prometheus in the preceding figure.
- Processors
Processors process data collected by receivers. For example, a common batch processor processes telemetry data in batches.
- Exporters
An exporter is how you send telemetry data to one or more backends. It allows a visual display of telemetry data for data analysis.
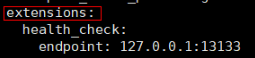
- Extensions
Extensions are available primarily for tasks that do not involve processing telemetry data. Extensions are optional. For example, you can add the health_check extension to check the health of otel-collector.
Using otel-collector on ASM of the Basic Edition
You can run the following command to obtain the settings of otel-collector.

The following uses the configuration file obtained from ASM of the basic edition as an example:
- receivers specifies that telemetry data can be obtained from Envoy proxies using zipkin and prometheus. prometheus specifies that data is captured from /stats/prometheus every 15 seconds.

- processors defines two data processing modes: batch and memory_limiter.

- exporters defines how processed telemetry data is exported to the APM server.

- extensions defines the health_check extension, which is used to check the health of otel-collector.
- service is used to configure the preceding defined configuration items used by otel-collector.

For example, in the preceding configuration file, two pipelines are configured for processing metrics and traces. (A pipeline consists of a receiver, a processor, and an exporter.) The log level is set to INFO or higher. The following figure shows the architecture used for processing metrics and traces.

Solution
No action is required.
Feedback
Was this page helpful?
Provide feedbackThank you very much for your feedback. We will continue working to improve the documentation.See the reply and handling status in My Cloud VOC.
For any further questions, feel free to contact us through the chatbot.
Chatbot


