
Help Center/
Application Service Mesh/
User Guide (ME-Abu Dhabi Region)/
User Guide/
Traffic Management/
Viewing Traffic Monitoring
Updated on 2024-03-18 GMT+08:00
Viewing Traffic Monitoring
Scenario
In the traffic management window, you can view the traffic monitoring data of the last hour, including RPS, success rate, and request latency.
Procedure
- Log in to the ASM console and click the name of the target service mesh to go to its details page.
- In the navigation pane, choose Service Management. In the upper right corner of the list, select the namespace that your services belong to.
- Locate the target service and click Manage Traffic in the Operation column. In the window that slides out from the right, view the traffic monitoring data of the last hour.
Figure 1 Traffic monitoring
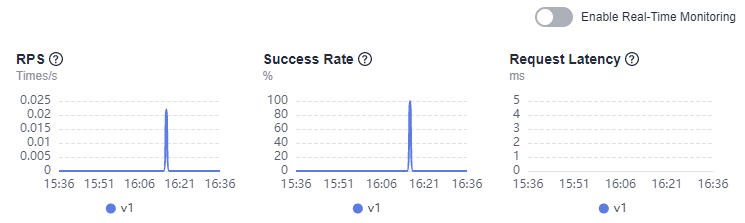
- After real-time monitoring is enabled, data is dynamically refreshed every minute.
Parent topic: Traffic Management
Feedback
Was this page helpful?
Provide feedbackThank you very much for your feedback. We will continue working to improve the documentation.See the reply and handling status in My Cloud VOC.
The system is busy. Please try again later.
For any further questions, feel free to contact us through the chatbot.
Chatbot


