
Web Security Overview
On the Dashboard page, you can view the protection logs of all protected websites or instances for a specified time range, including yesterday, today, past 3 days, past 7 days, or past 30 days. The protection statistics include the number of attacks of each type, top 5 attacked domain names, top 5 attack source IP addresses, and top 5 attacked URLs.
Statistics on the Web Security Overview page are updated every minute.

If you have enabled enterprise projects, you can select your enterprise project from the Enterprise Project drop-down list and view security statistics data of the project.
Prerequisites
- A domain name has been added and connected. For details, see Adding a Website to EdgeSec.
- At least one protection rule has been configured for the domain name.
Specification Limitations
On the Dashboard page, protection data of a maximum of 30 days can be viewed.
Procedure
- Log in to the EdgeSec console.
- In the navigation pane on the left, choose Dashboard under Edge Security. The Dashboard page is displayed.
- Select Enterprise project at the top of the page, set the domain name, website, and query time, and view the total number of attacks and pages attacked by each type of attack.
- Query time: You can select Yesterday, Today, Past 3 days, Past 7 days, or Past 30 days.
- Attacks: shows how many times the website are attacked.
An alarm is generated when the number of attacks on a single domain name reaches 100,000 within 5 minutes. You can click Message Center button in the upper right corner of the console and choose to view detailed alarm information on the O&M tab page.
- You can view how many requests are attacked by a certain type of attacks within a certain period of time.
- Click the Horizontally Select icon
 on the right to select a time segment. This will zoom in and display detailed data for the specified period.
Figure 1 Protection action statistics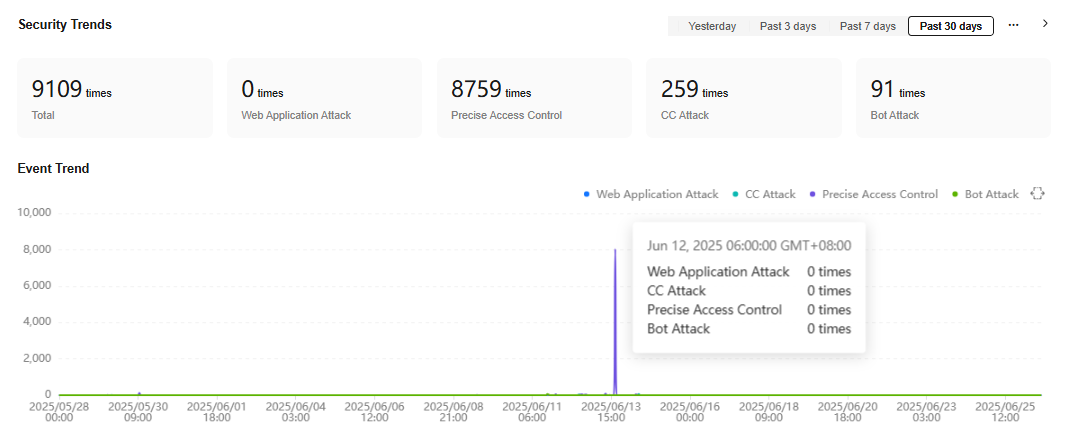
- Query security data.
Figure 2 Web security event statistics

Table 1 Web security event statistics parameters Parameter
Description
Top 5 Attacked Domain Names
The five most attacked domain names and the number of attacks on each domain name.
You can click domain name to go to the Web Protection Events page and view more protection details.
Top 5 Attack Source IP Addresses
The five source IP addresses with the most attacks and the number of attacks from each source IP address.
You can click IP address to go to the Web Protection Events page and view more protection details.
Top 5 Attacked URLs
The five most attacked URLs and the number of attacks on each URL.
You can click URL to go to the Web Protection Events page and view more protection details.
Attack Request Distribution
Types of attack events.
You can click a type to view the type, count, and proportion of an attack.
Feedback
Was this page helpful?
Provide feedbackThank you very much for your feedback. We will continue working to improve the documentation.See the reply and handling status in My Cloud VOC.
For any further questions, feel free to contact us through the chatbot.
Chatbot


