
Introduction to Instance Overview
On the Overview page, you can get knowledge of the overall status of your RDS for MySQL instance, including alarms, intelligent anomaly diagnosis, and key performance metrics. Intelligent anomaly diagnosis uses operational data analytics and intelligent algorithms to access instance health, and provides you with solutions and suggestions for handling detected exceptions.
Functions
Table 1 lists the functions provided on the Overview page.
|
Function |
Description |
|---|---|
|
Instance Information |
Shows basic information about your instance and allows you to modify the instance.
|
|
Alarms |
Shows the active alarms of your instance, including alarms in the Alarm (metric) or Triggered (event) state. |
|
Intelligent Anomaly Diagnosis |
Shows the health status of your instance based on operational data analytics and intelligent algorithms. |
|
Performance Monitoring |
Shows key performance metrics of the instance, including the CPU usage, memory usage, slow SQL queries, and connections. |
|
Storage & Backup |
Shows the storage space and backup space usage of your instance, and allows you to scale up the storage. |
Instance Overview
- Click
 in the upper left corner and select a region.
 - Click
 in the upper left corner of the page and choose Databases > Relational Database Service.
 - On the Instances page, click the target instance name to go to the Overview page.
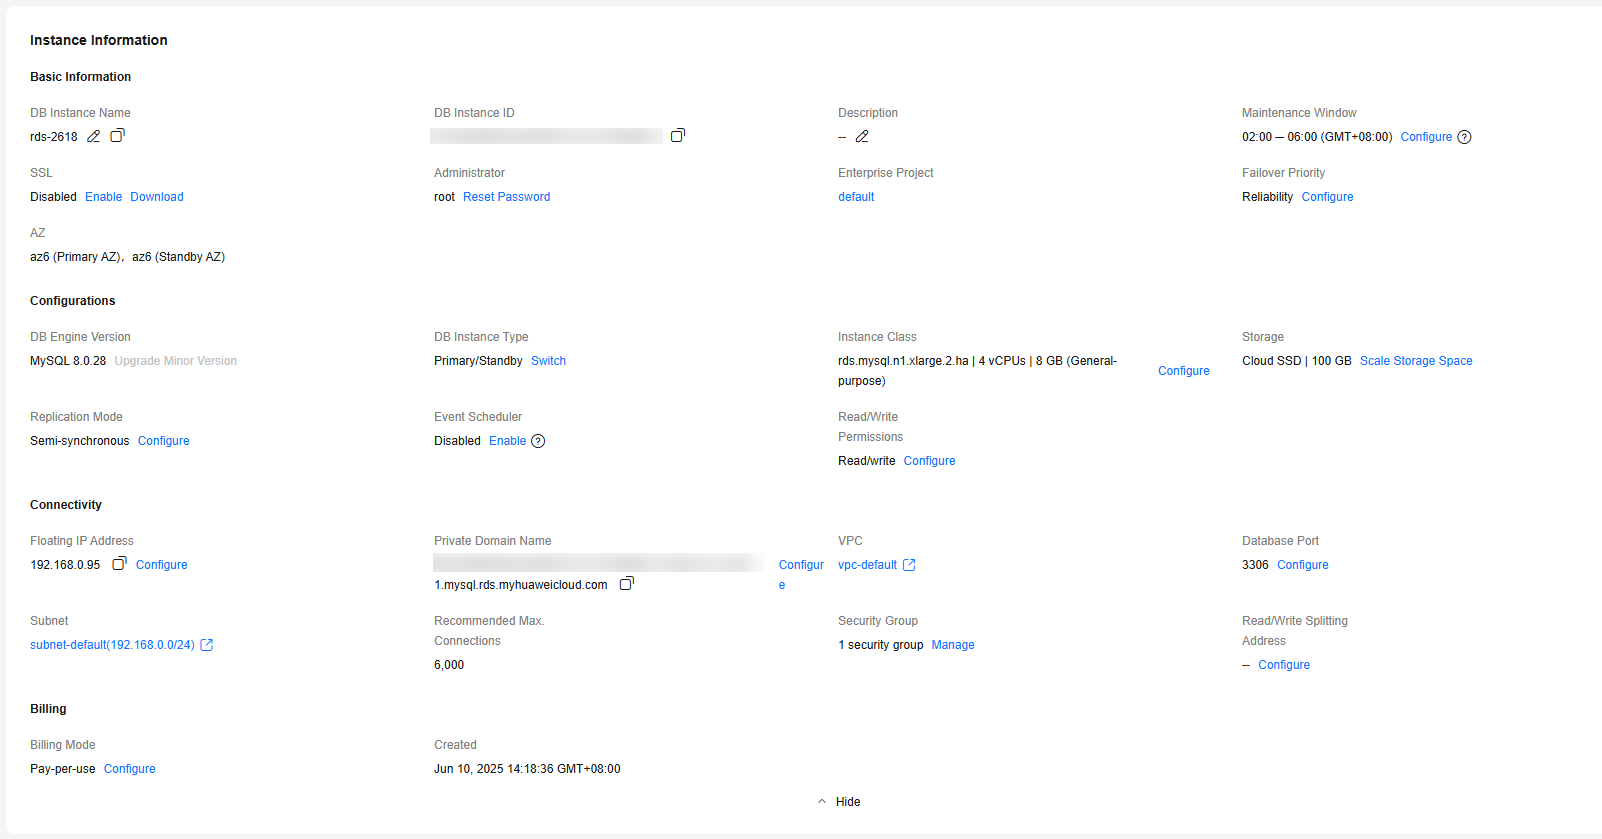
- In the Instance Information area, check the instance information and modify the instance as required.
Figure 1 Instance Information
In the Alarms area, check alarm information of your instance.
Based on the configured alarm rules, you can see active alarms of your instance, including alarms in the Alarm (metric) or Triggered (event) state.
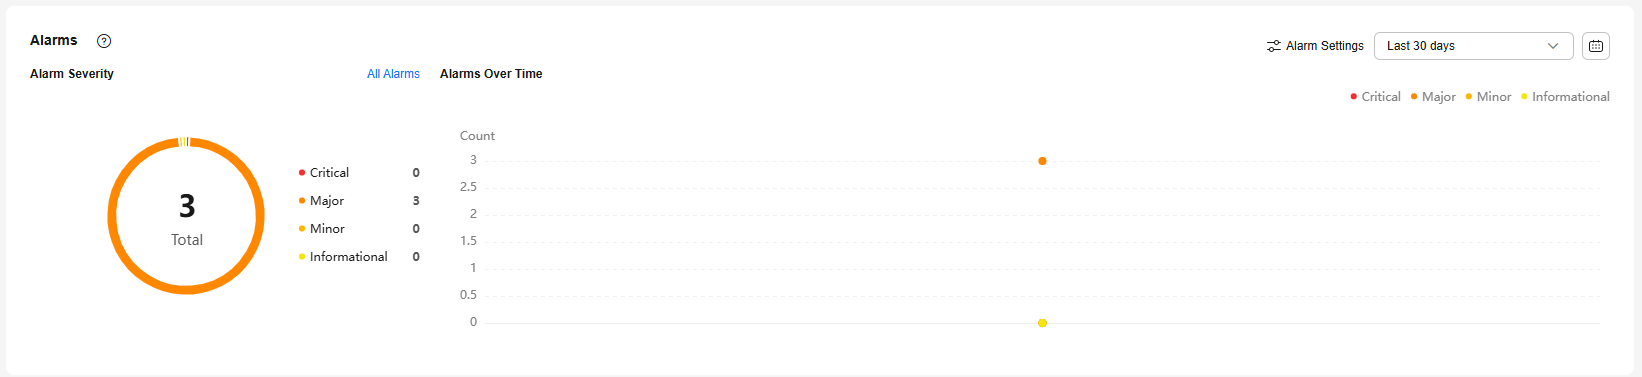
- To check all alarm records, click All Alarms.
- To configure alarm rules, click Alarm Settings.
- To check alarms over time, select a time window in the upper part of the Alarms area.
The time window can be last 1 hour, last 6 hours, last 12 hours, last 24 hours, last 7 days, last 30 days, or a custom time period.
In the Intelligent Anomaly Diagnosis area, view the health diagnosis results of your instance.
Intelligent Anomaly Diagnosis checks instance health using instance operation data and intelligent algorithms and provides diagnosis results and suggestions. It provides diagnosis results for check items in the past 5 minutes. If any diagnosis result is abnormal, the check item is abnormal in the past 5 minutes.
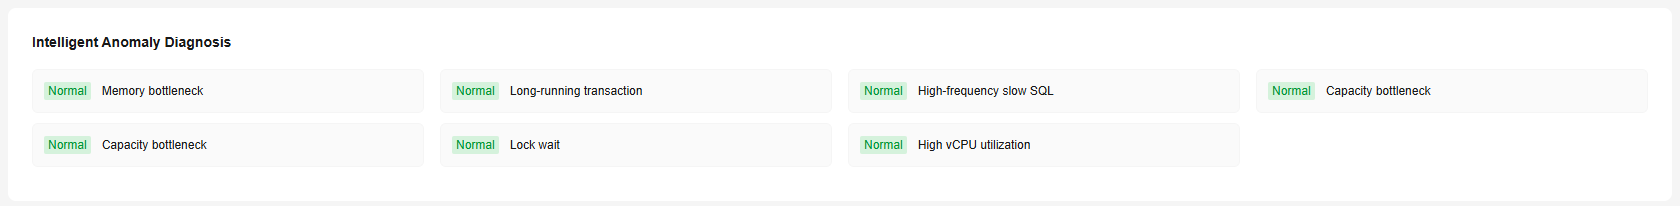
Table 2 provides the supported diagnosis items and handling suggestions.
|
Diagnosis Item |
Metric |
Metric Description |
Handling Suggestions |
Practices |
|---|---|---|---|---|
|
Memory bottleneck |
Memory Usage (%) |
Memory usage of the monitored object |
|
|
|
Total Connections (Count) |
Total number of connections that attempt to connect to the MySQL server |
|||
|
Current Active Connections (Count) |
Number of connections that are not in the sleep state |
|||
|
Long-running transaction |
Long Transaction (s) |
Maximum duration for starting a transaction A complete long transaction is counted only when the BEGIN and COMMIT commands exist before and after the related operation commands, respectively. |
Obtain the session ID of a long-running transaction and run the kill command to terminate it. |
|
|
High-frequency slow SQL |
Slow Query Logs (Count/min) |
Number of MySQL slow query logs generated per minute |
|
Slow SQL Statements Due to Improper Composite Index Settings |
|
Capacity bottleneck |
Storage Space Usage (%) |
Storage space usage of the monitored object |
|
|
|
Used Storage Space (GB) |
Used storage space of the monitored object |
|||
|
Total Storage Space (GB) |
Total storage space of the monitored object |
|||
|
Storage bottleneck |
IOPS (Times/s) |
Average number of I/O requests processed by the system in a specified period |
|
|
|
The time percentage of disk I/O in a non-idle state |
Percentage of time when the disk is not idle (there are I/O activities). This parameter indicates how busy the disk is. The disk can process I/O requests in parallel. Even if the value of this parameter reaches 100%, the disk may not reach its maximum processing capability. |
|||
|
Disk Read Throughput (Bytes/s) |
Number of bytes read from the disk per second |
|||
|
Disk Write Throughput (Bytes/s) |
Number of bytes written into the disk per second |
|||
|
Lock wait |
Row Locks Waits Transactions (Counts) |
Number of InnoDB row lock waits This metric indicates the total number of historical transactions waiting for row locks. Lock waits will be cleared after the instance is rebooted. |
For details, see Managing Locks & Transactions. |
|
|
Average Row Lock Wait Time (ms) |
Average wait time of historical InnoDB row locks |
|||
|
Current Row Lock Waits (Counts) |
Number of current InnoDB row lock waits This metric indicates the number of transactions that are currently waiting for row locks. |
|||
|
MDL Locks (Counts) |
Number of metadata locks |
|||
|
High vCPU utilization |
CPU Usage (%) |
CPU usage of the monitored object |
|
|
|
TPS (Times/s) |
Execution times of submitted and rollback transactions per second |
|||
|
QPS (Times/s) |
Query times of SQL statements (including stored procedures) per second |
In the Performance Monitoring area, you can view the vCPUs (used/total), memory (used/total), slow SQL logs, and connections of your instance.
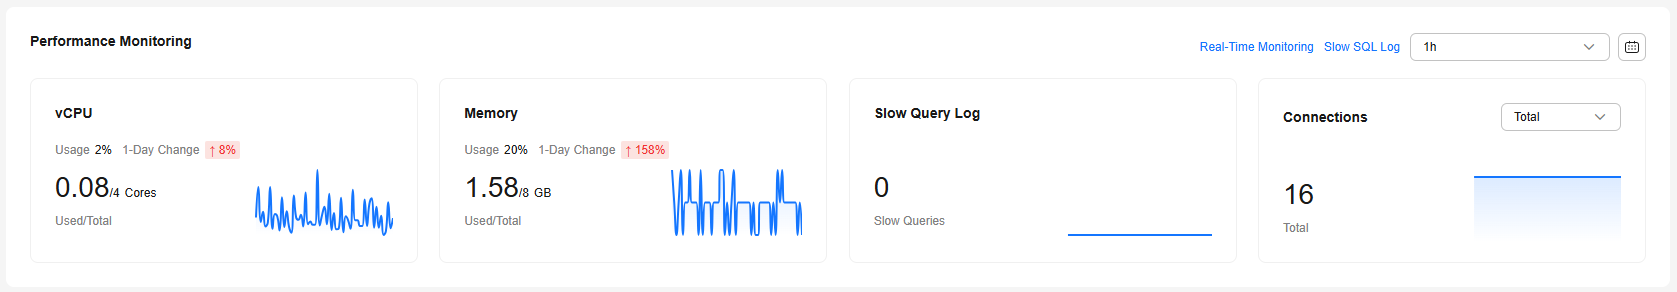
- To check all metrics, click Real-Time Monitoring to go to the DBA Assistant page. For details, see Viewing Performance Metrics of a DB Instance.
- To check the analysis results of slow queries, click Slow SQL Log to go to the DBA Assistant page. For details, see Viewing Slow Query Logs of a DB Instance.
- To check metric changes over time, select a time range in the upper part.
The time window can be last 1 hour, last 6 hours, last 12 hours, last 24 hours, last 7 days, last 30 days, or a custom time period.
In the Storage & Backup area, you can check the storage space usage and backup space usage of your instance, enable disk encryption, and scale up storage space.
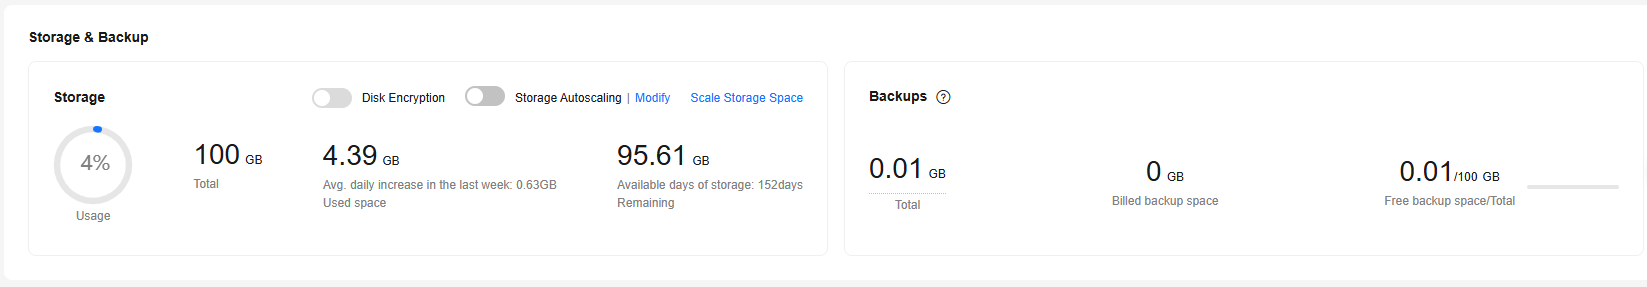
- Files that occupy the storage space include data files, log files, and other temporary files. To check the distribution and changes of used storage, see Managing Storage Capacity.
- After an instance is purchased, the disk encryption status and the key cannot be changed.
If you enable disk encryption when purchasing an instance, the new storage space after scale-up still uses the original encryption key. Keep the key secure. Once the key is disabled, deleted, or frozen, your instance will become inaccessible.
- As workload data increases, the storage capacity of your instance may be insufficient. To scale up the storage space, see Scaling Up Storage Space.
- Backups are stored as packages in OBS and occupy the backup space. If the free space RDS provides is used up, the additional space required will be billed. For the billing details, see How Is RDS Backup Data Billed?
Feedback
Was this page helpful?
Provide feedbackThank you very much for your feedback. We will continue working to improve the documentation.See the reply and handling status in My Cloud VOC.
For any further questions, feel free to contact us through the chatbot.
Chatbot


