
Example of Configuring Flow Logs: Checking the Traffic Between VPCs Connected By an Enterprise Router
Solution Architecture
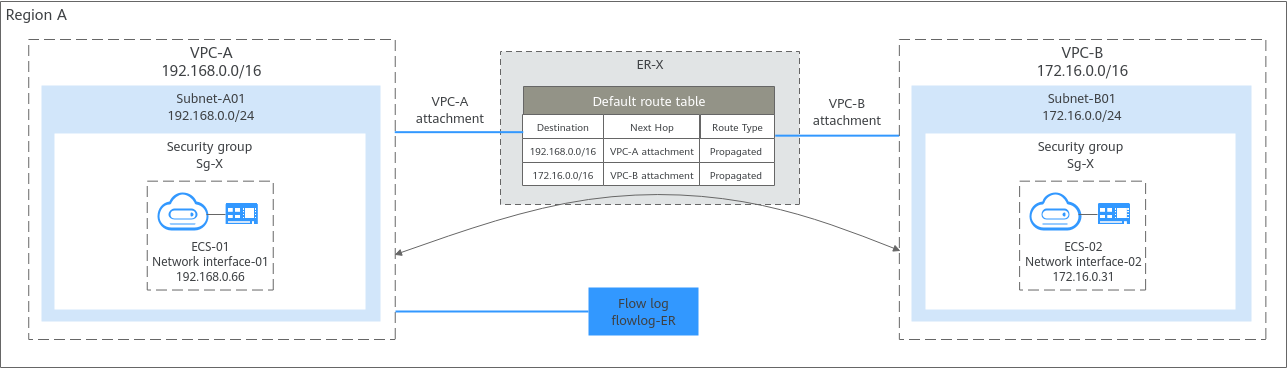
In this example, enterprise router ER-X is used to connect two VPCs (VPC-A and VPC-B). To view the traffic between the two VPCs and locate issues, you need to create a flow log for the enterprise router to collect the logs of VPC-A attachment.
Constraints
For details about the constraints on flow logs, see Enterprise Router Flow Log Constraints.
Resource Planning

The following resource details are only for your reference. You can modify them if needed.
| Resource | Quantity | Description |
|---|---|---|
| VPC and subnet | VPC: 2 Subnet: 2 |
|
| ECS | 2 | Configure the two ECSs as follows:
|
| Enterprise router | 1 |
|
| Enterprise router flow log | 1 |
|
| Direction | Action | Type | Protocol & Port | Source/Destination | Description |
|---|---|---|---|---|---|
| Inbound | Allow | IPv4 | TCP: 22 | Source: 0.0.0.0/0 | Allows remote logins to Linux ECSs over SSH port 22. |
| Inbound | Allow | IPv4 | TCP: 3389 | Source: 0.0.0.0/0 | Allows remote logins to Windows ECSs over RDP port 3389. |
| Inbound | Allow | IPv4 | All | Source: current security group (Sg-X) | Allows the ECSs in Sg-X to communicate with each other using IPv4 addresses. |
| Inbound | Allow | IPv6 | All | Source: current security group (Sg-X) | Allows the ECSs in Sg-X to communicate with each other using IPv6 addresses. |
| Outbound | Allow | IPv4 | All | Destination: 0.0.0.0/0 | Allows ECSs in Sg-X to access the external networks using IPv4 addresses. |
| Outbound | Allow | IPv6 | All | Destination: ::/0 | Allows ECSs in Sg-X to access the external networks using IPv6 addresses. |

If the source of an inbound rule is set to 0.0.0.0/0, all external IP addresses are allowed to remotely log in to your instances. Exposing port 22 or 3389 to the public network will leave your instances vulnerable to network risks. To address this issue, set the source to a trusted IP address, for example, the IP address of your local PC.
| Security Group | Direction | Action | Type | Protocol & Port | Source | Description |
|---|---|---|---|---|---|---|
| Sg-X | Inbound | Allow | IPv4 | All | Security group Sg-A | Allows IPv4 traffic from ECSs in Sg-A to reach ECSs in Sg-X. |
| Sg-A | Inbound | Allow | IPv4 | All | Security group Sg-X | Allows IPv4 traffic from ECSs in Sg-X to reach ECSs in Sg-A. |
Procedure
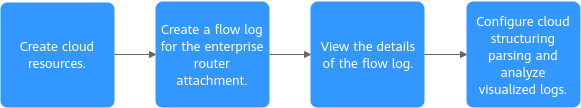
Figure 2 shows the process for viewing the traffic between ECSs in different VPCs.
Step 1: Create Cloud Resources
- Create two VPCs, each with a subnet.
For details, see Creating a VPC with a Subnet.
- Create two ECSs.
For details, see Purchasing an ECS in Custom Config Mode.
- Create an enterprise router.
For details, see Creating an Enterprise Router.
- Attach the two VPCs to the enterprise router.
If you enable Auto Add Routes when creating a VPC attachment, you do not need to manually add static routes to the VPC route table. After the VPC attachments are added, the two VPCs can communicate with each other.
For details, see Creating VPC Attachments for the Enterprise Router.
For details about network planning using an enterprise router, see Using an Enterprise Router to Enable Communications Between VPCs in the Same Region.
Step 2: Create an Enterprise Router Flow Log
- Create a log group and log stream on the LTS console.
For details about how to create a log group, see Creating a Log Group.
For details about how to create a log stream, see Creating a Log Stream.
- Create an enterprise router flow log.
For details, see Creating a Flow Log.
Step 3: View the Flow Log
The flow log collects the information of traffic flowing through attachment er-attach-vpc-A corresponding to VPC-A.
- Remotely log in to ECS-01 in VPC-A.
For details, see How Do I Log In to My ECS?
- Ping ECS-02 in VPC-B from ECS-01 in VPC-A and collect logs:
ping <private-IP-address-of-ECS-02>
Example command:
ping 172.16.0.31
Information similar to the following is displayed. You can view the flow log records in about 10 minutes. Do not stop the ping command during flow log collection.[root@ecs-01 ~]# ping 172.16.0.31 PING 172.16.0.31 (172.16.0.31) 56(84) bytes of data. 64 bytes from 172.16.0.31: icmp_seq=1 ttl=63 time=0.510 ms 64 bytes from 172.16.0.31: icmp_seq=2 ttl=63 time=0.392 ms 64 bytes from 172.16.0.31: icmp_seq=3 ttl=63 time=0.332 ms ...
- Wait for about 10 minutes and view the flow log information by referring to Viewing Details About a Flow Log.
You can enter the IP address (172.16.0.31) of ECS-02 in the search box to quickly filter the logs of the communication between ECS-01 and ECS-02.
Figure 3 Viewing logs Flow log format:
<version> <project_id> <resource_id> <instance_id> <srcaddr> <dstaddr> <srcport> <dstport> <protocol> <packets> <bytes> <start> <end> <direct>
- Example log: 1 f0512a6441dc47189f5e03a428f48267 37befd9d-58a8-4a5f-9cb1-13a3fe563c20 bdc50d41-a33a-4bf5-9391-4957369d17b6 192.168.0.66 172.16.0.31 8 0 1 586 57428 1742872080 1742872680 ingress
- Log description: The enterprise router log version is 1. Within the 10 minutes from 11:08:00 to 11:18:00 on March 25, 2025, the traffic from VPC-A attachment (ID: 37befd9d-58a8-4a5f-9cb1-13a3fe563c20) flowing to (ingress) the enterprise router (bdc50d41-a33a-4bf5-9391-4957369d17b6) was recorded. The log shows that 586 echo request (type=8,code=0) packets were sent from the source 192.168.0.66 to the destination 172.16.0.31 through ICMP (protocol=1). The size of all packets is 57,428 bytes.
Step 4: Configure Cloud Structuring Parsing and Analyze Visualized Logs for the Enterprise Router Flow Log
- Configure cloud structuring parsing.
Table 4 shows the parameter settings in this example. For details, see Cloud Structuring Parsing.
Figure 4 Configuring cloud structuring parsing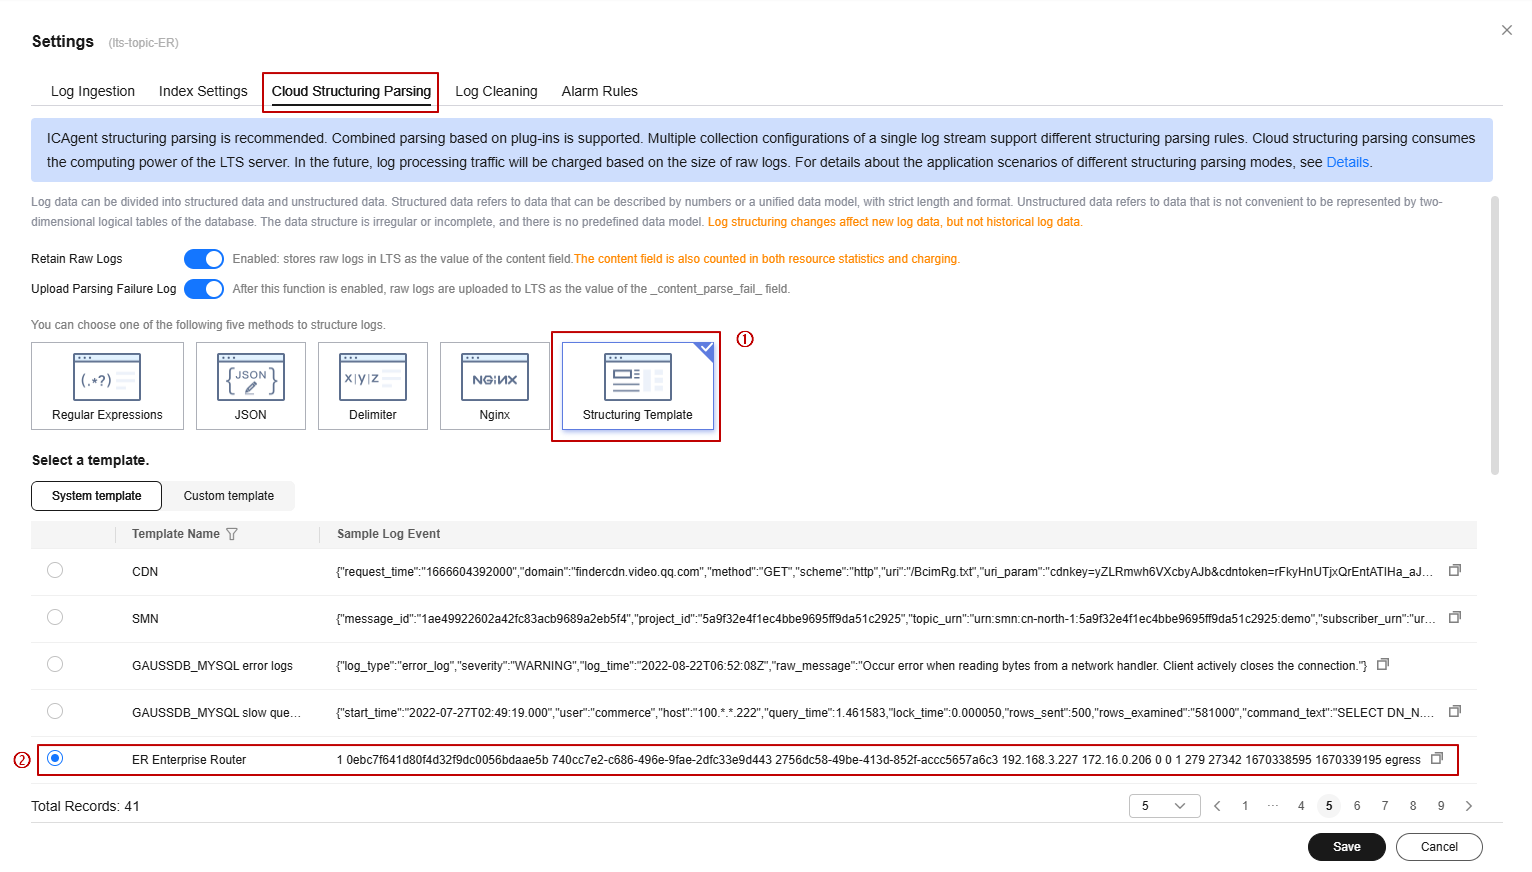
- Analyze the logs based on the cloud structuring parsing. The following shows two visualized log analysis methods:
- Visualize logs in statistical charts. Statistical charts, such as tables, bar charts, and line charts, are rendered by LTS based on SQL query syntax.
- On the Log Analysis tab, enter the required statement in the search box by referring to Using SQL Analysis Syntax to obtain the required logs.
The following takes the traffic of ECS-01 every hour as an example.
SELECT TIME_FORMAT(TIME_CEIL(__time, 'PT1H'), 'yyyy-MM-dd HH:mm:ss') as "time", count(1) as pv group by "time"
- On the right of the page, configure the time and other information.
In this example, you can view the hourly traffic data within a day. For more information about the statistical charts, see Statistical Charts.
Figure 5 Traffic bar chart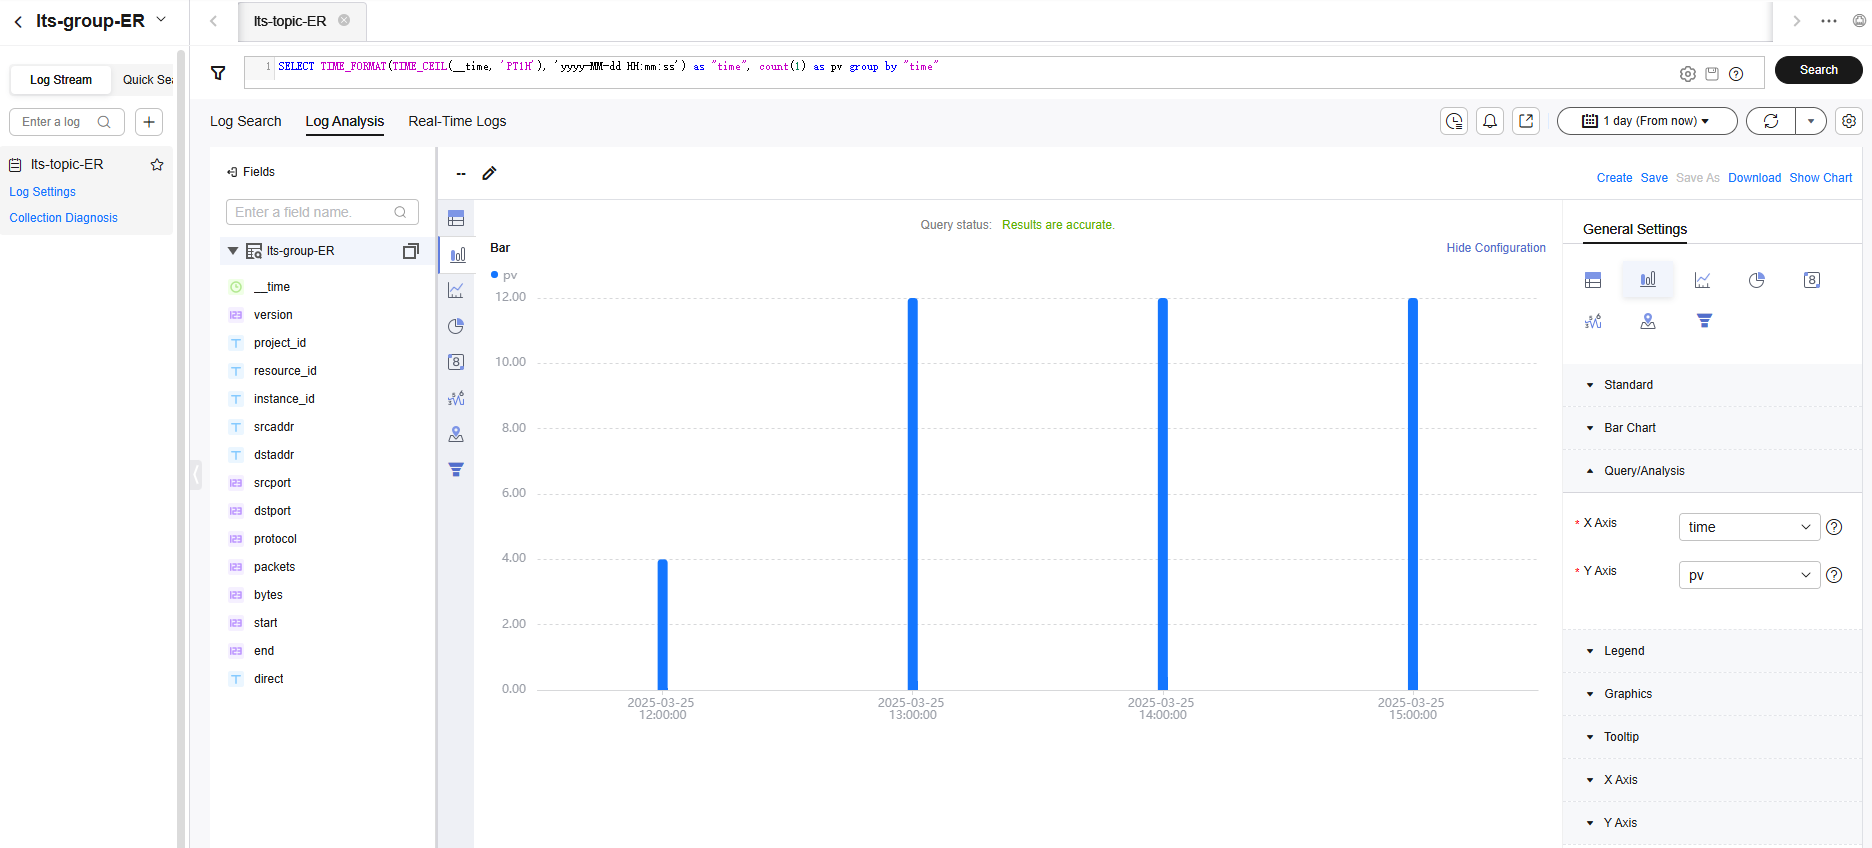
- On the Log Analysis tab, enter the required statement in the search box by referring to Using SQL Analysis Syntax to obtain the required logs.
- Visualize logs in dashboards. The dashboard is a real-time data visualization tool provided by LTS.
- After an enterprise router flow log is created, choose Dashboards > ER dashboard templates > Enterprise Router Flow Log Center on the LTS console.
On the enterprise router dashboard details page, wait for several minutes and view the flow log data. In this example, select the instance and the attachment to view flow log information. For more dashboard information, see ER Dashboard Template.
Figure 6 Enterprise router flow log dashboard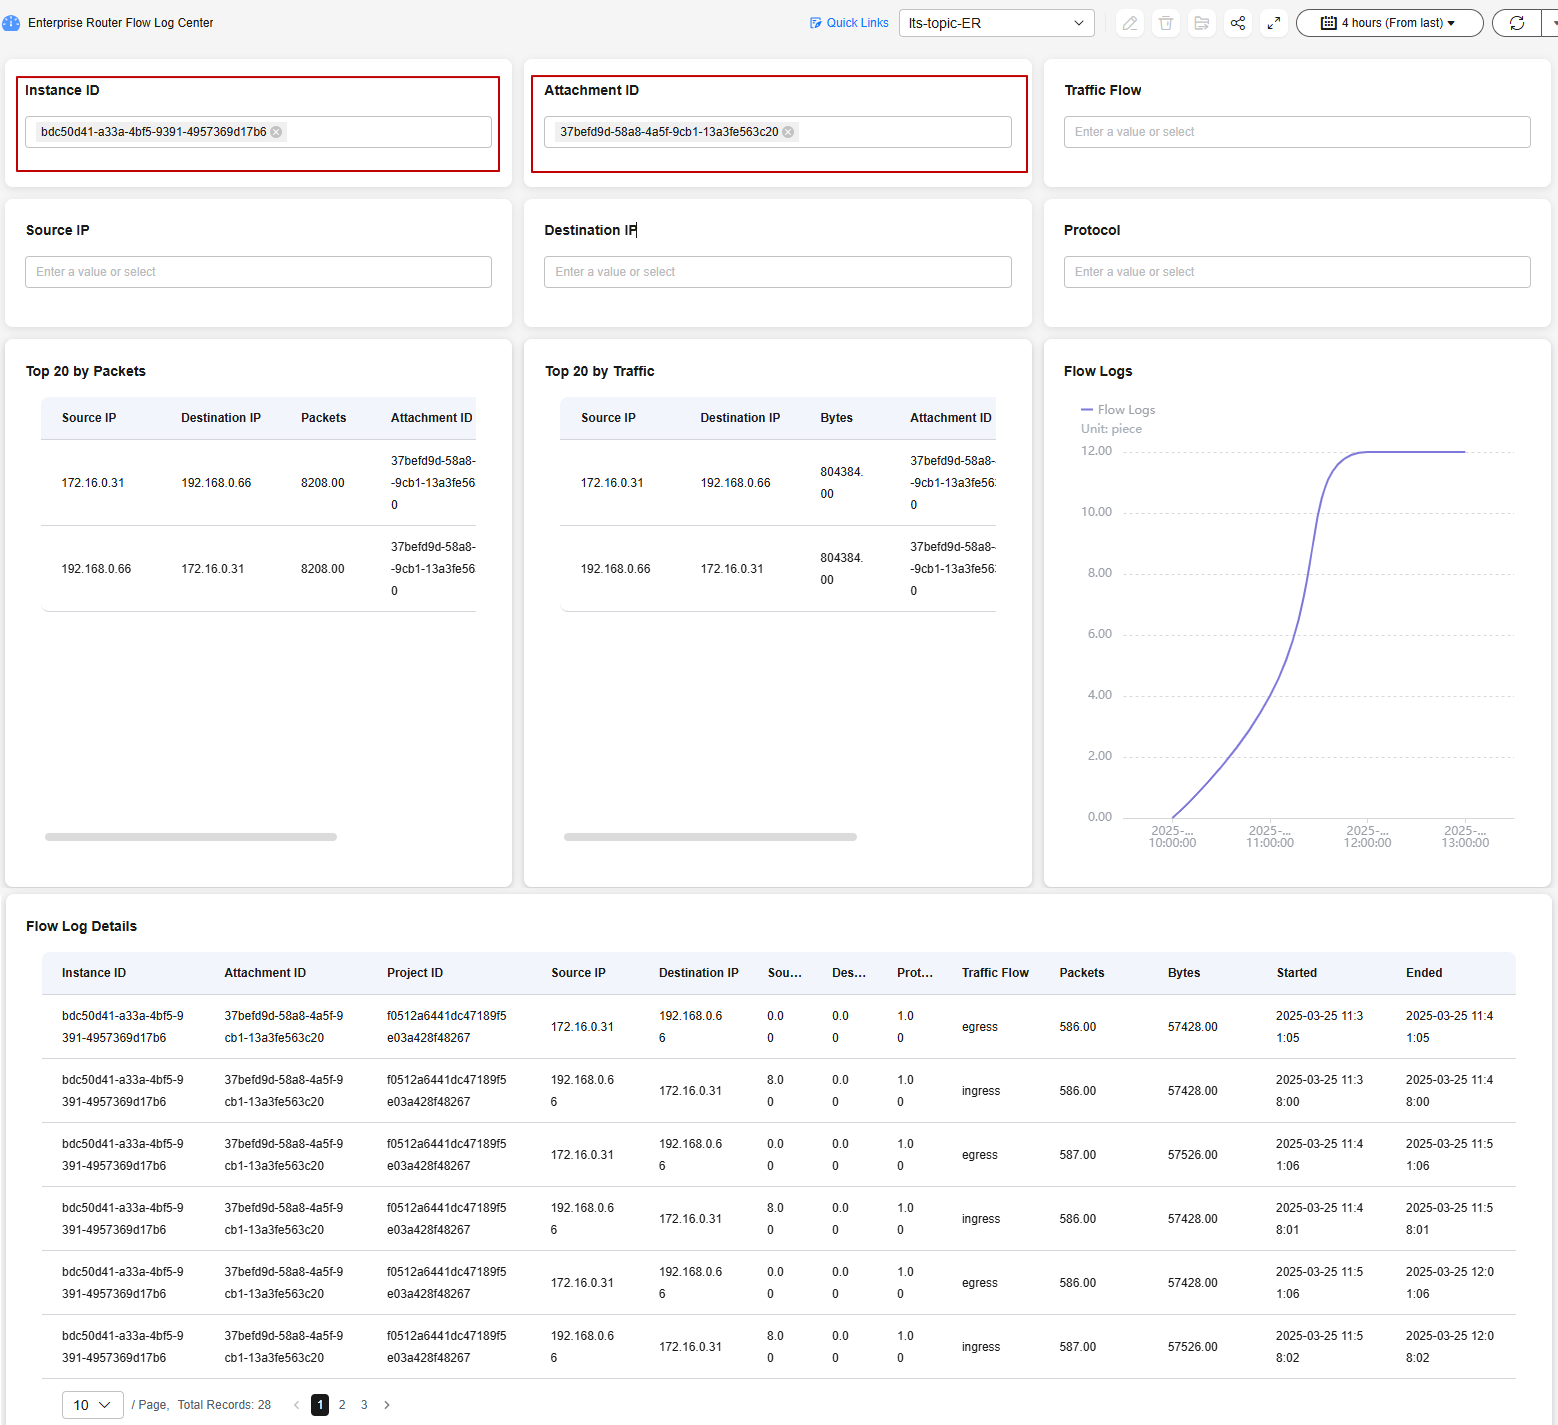
- After an enterprise router flow log is created, choose Dashboards > ER dashboard templates > Enterprise Router Flow Log Center on the LTS console.
- Visualize logs in statistical charts. Statistical charts, such as tables, bar charts, and line charts, are rendered by LTS based on SQL query syntax.
Feedback
Was this page helpful?
Provide feedbackThank you very much for your feedback. We will continue working to improve the documentation.See the reply and handling status in My Cloud VOC.
For any further questions, feel free to contact us through the chatbot.
Chatbot


