

Viewing the Traffic from ECSs to the Internet Through a NAT Gateway
Solution Architecture
In this example, multiple ECSs are deployed in the same VPC subnet and use an SNAT rule of a public NAT gateway to access the Internet. When the traffic from the NAT gateway to the Internet increases sharply, O&M engineers need to identify the ECSs generating high traffic. To do this, they need to create a flow log to collect flow logs of the subnet for analysis and fault locating.

Constraints
For details about the restrictions on flow logs, see Constraints.
Resource Planning

The following resource details are only for your reference. You can modify them if needed.
| Resource | Quantity | Description |
|---|---|---|
| VPC and subnet | VPC: 1 Subnet: 1 |
|
| ECS | 3 | Configure the three ECSs as follows:
|
| EIP | 1 | In this example, one EIP (121.XX.XX.73) is required. Configure parameters such as EIP type and bandwidth as required. |
| Public NAT gateway | 1 |
|
| VPC flow log | 1 |
|
| Direction | Action | Type | Protocol & Port | Source/Destination | Description |
|---|---|---|---|---|---|
| Inbound | Allow | IPv4 | TCP: 22 | Source: 0.0.0.0/0 | Allows remote logins to Linux ECSs over SSH port 22. |
| Inbound | Allow | IPv4 | TCP: 3389 | Source: 0.0.0.0/0 | Allows remote logins to Windows ECSs over RDP port 3389. |
| Inbound | Allow | IPv4 | All | Source: current security group (Sg-X) | Allows the ECSs in Sg-X to communicate with each other using IPv4 addresses. |
| Inbound | Allow | IPv6 | All | Source: current security group (Sg-X) | Allows the ECSs in Sg-X to communicate with each other using IPv6 addresses. |
| Outbound | Allow | IPv4 | All | Destination: 0.0.0.0/0 | Allows ECSs in Sg-X to access the external networks using IPv4 addresses. |
| Outbound | Allow | IPv6 | All | Destination: ::/0 | Allows ECSs in Sg-X to access the external networks using IPv6 addresses. |

If the source of an inbound rule is set to 0.0.0.0/0, all external IP addresses are allowed to remotely log in to your instances. Exposing port 22 or 3389 to the public network will leave your instances vulnerable to network risks. To address this issue, set the source to a trusted IP address, for example, the IP address of your local PC.
Procedure
Figure 2 shows the process for viewing the traffic from ECSs to the Internet through a NAT gateway.

Step 1: Create Cloud Resources
- Create a VPC with a subnet.
For details, see Creating a VPC with a Subnet.
- Create ECSs.
For details, see Purchasing an ECS in Custom Config Mode.
- Assign an EIP.
For details, see Assigning an EIP.
- Create a public NAT gateway.
For details, see Buying a Public NAT Gateway.
- Configure an SNAT rule for the public NAT gateway.
For details, see Adding an SNAT Rule.
Step 2: Create a VPC Flow Log
- Create a log group and log stream on the LTS console.
For details about how to create a log group, see Creating a Log Group.
For details about how to create a log stream, see Creating a Log Stream.
- Create a VPC flow log.
For details, see Creating a VPC Flow Log.
Step 3: View the VPC Flow Log
In this example, the flow log of Subnet-A01 is collected. You can ping a public IP address from ECS-03 to generate traffic for observation. Flow logs are collected at the subnet level. Traffic generated by any ECS in the subnet is reported, allowing you to identify ECSs with abnormal traffic.
- Remotely log in to ECS-03.
For details, see How Do I Log In to My ECS?
- Ping an IP address on the Internet from ECS-03 and collect logs:
ping <IP-address-on-the-Internet>
Example command:
ping 117.XX.XX.122
Information similar to the following is displayed. You can view the flow log records in about 10 minutes. Do not stop the ping command during flow log collection.[root@ecs-03 ~]# ping 117.XX.XX.122 PING 117.XX.XX.122 (117.XX.XX.122) 56(84) bytes of data. 64 bytes from 117.XX.XX.122: icmp_seq=1 ttl=49 time=26.5 ms 64 bytes from 117.XX.XX.122: icmp_seq=2 ttl=49 time=26.3 ms 64 bytes from 117.XX.XX.122: icmp_seq=3 ttl=49 time=26.2 ms ...
- Wait for about 10 minutes and view the VPC flow log information. For details, see Viewing a VPC Flow Log.
You can enter the IP address (117.XX.XX.122) in the search box to quickly filter the logs of the communication between an ECS in the subnet and the Internet.
Figure 3 Viewing logs
 The flow log record is in the following format:
<version> <project-id> <interface-id> <srcaddr> <dstaddr> <srcport> <dstport> <protocol> <packets> <bytes> <start> <end> <action> <log-status>
- Example log: 1 1XX89aca74e640d9848a37dea0315d99 ff3fcb8c-25b5-4fe4-9da6-b8857a6150e2 117.XX.XX.122 192.168.0.42 0 0 1 599 58702 1782959031 1782959631 ACCEPT OK
- Log description: The VPC flow log version is 1. During the 10 minutes from 10:23:51 to 10:33:51 on July 2, 2026, the network interface (ff3fcb8c-25b5-4fe4-9da6-b8857a6150e2) accepted the following packets. A total of 599 echo request (type=8,code=0) packets were sent from the source IP address (192.168.0.42) to the destination IP address (117.XX.XX.122) using ICMP (protocol=1). The total size of all packets was 58,702 bytes.
For details about flow log data, see VPC Flow Log Data.
Step 4: Configure Cloud Structuring Parsing and Analyze Visualized Logs for the VPC Flow Log
- Configure cloud structuring parsing.
Table 3 shows the parameter settings in this example. For details, see Cloud Structuring Parsing.
Figure 4 Configuring cloud structuring parsing
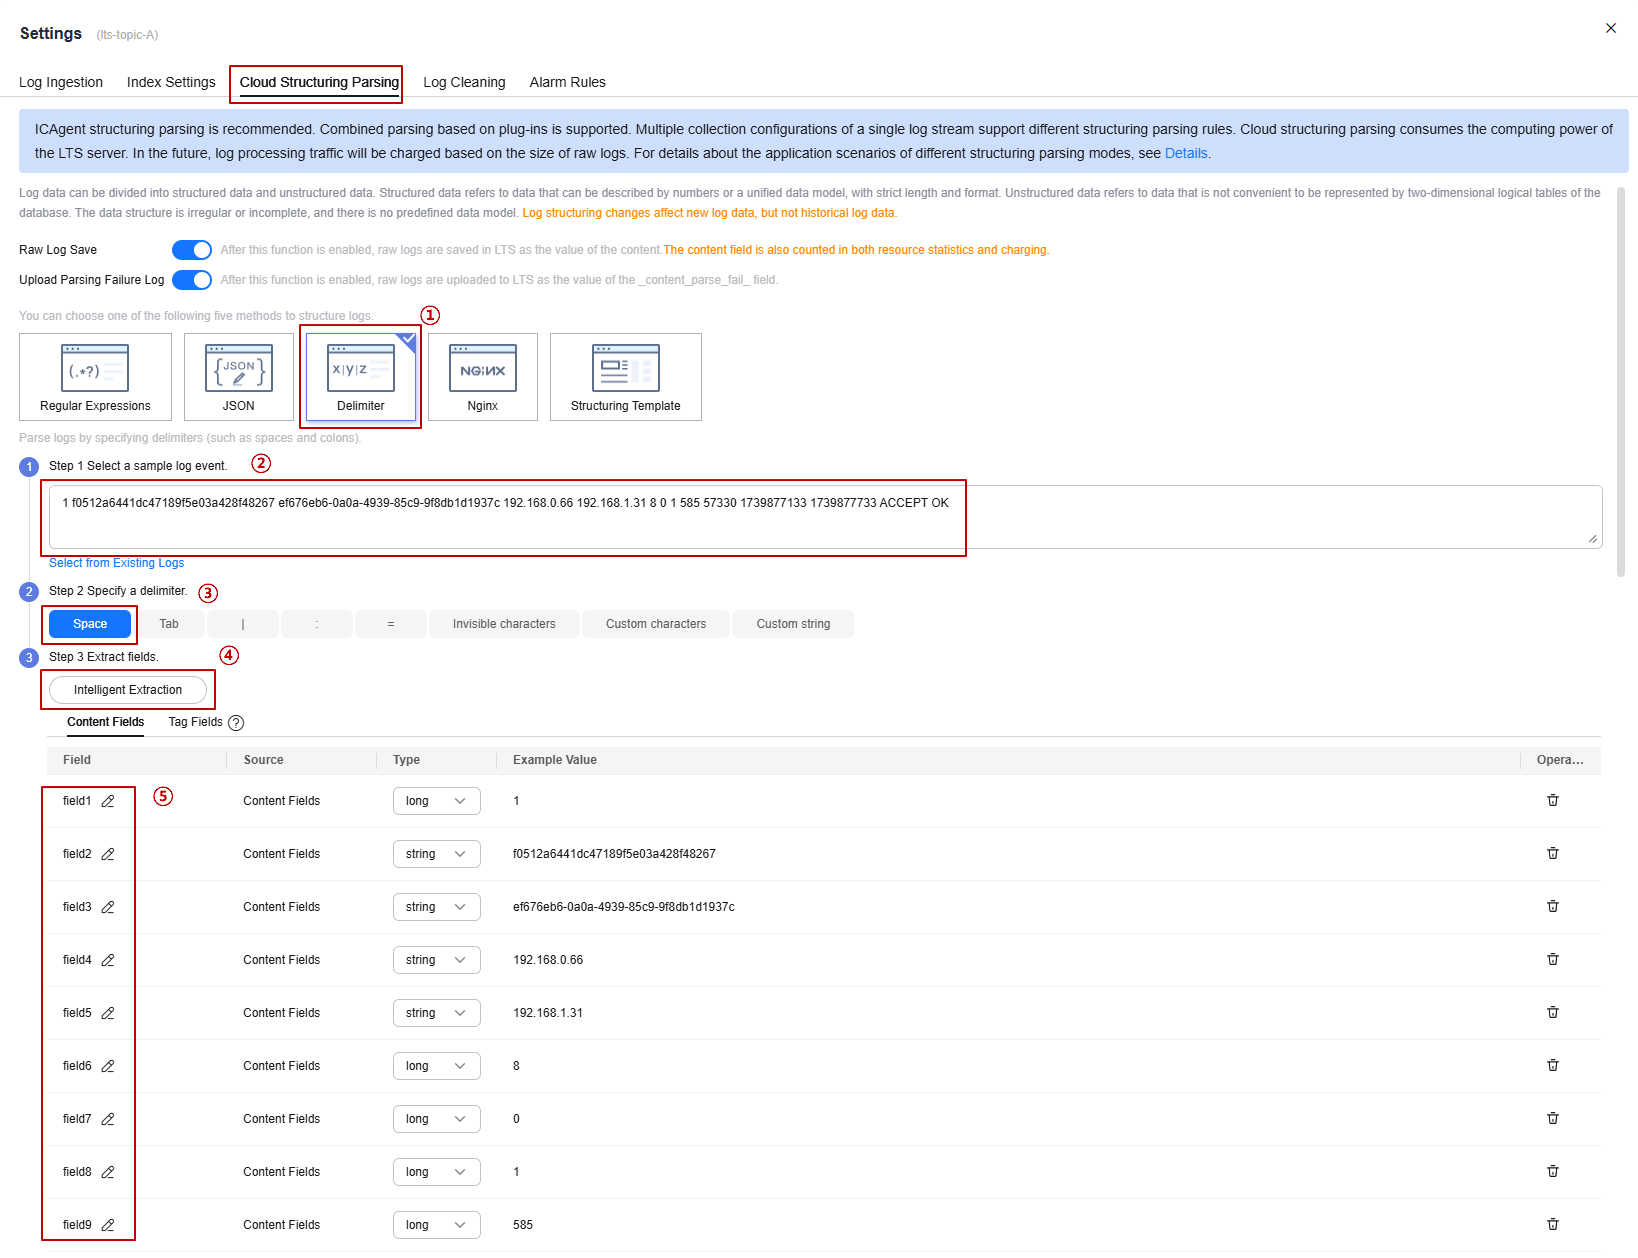
Table 3 Parameters for configuring cloud structuring parsing Step
Operation
1
Set the structuring mode to Delimiter.
2
Enter the VPC flow log:
1 f0512a6441dc47189f5e03a428f48267 ef676eb6-0a0a-4939-85c9-9f8db1d1937c 192.168.0.66 192.168.1.31 8 0 1 585 57330 1739877133 1739877733 ACCEPT OK
3
Select Space as the delimiter.
4
Click Intelligent Extraction.
5
In the intelligent extraction field list, change the field name to the flow log parameters:
version, project-id, interface-id, srcaddr, dstaddr, srcport, dstport, protocol, packets, bytes, start, end, action, and log-status
- Analyze the logs based on the cloud structuring parsing. The following shows two visualized log analysis methods:
- Visualize logs in statistical charts. Statistical charts, such as tables, bar charts, and line charts, are rendered by LTS based on SQL query syntax.
- On the Log Analysis tab, enter the required statement in the search box by referring to Using SQL Analysis Syntax to obtain the required logs.
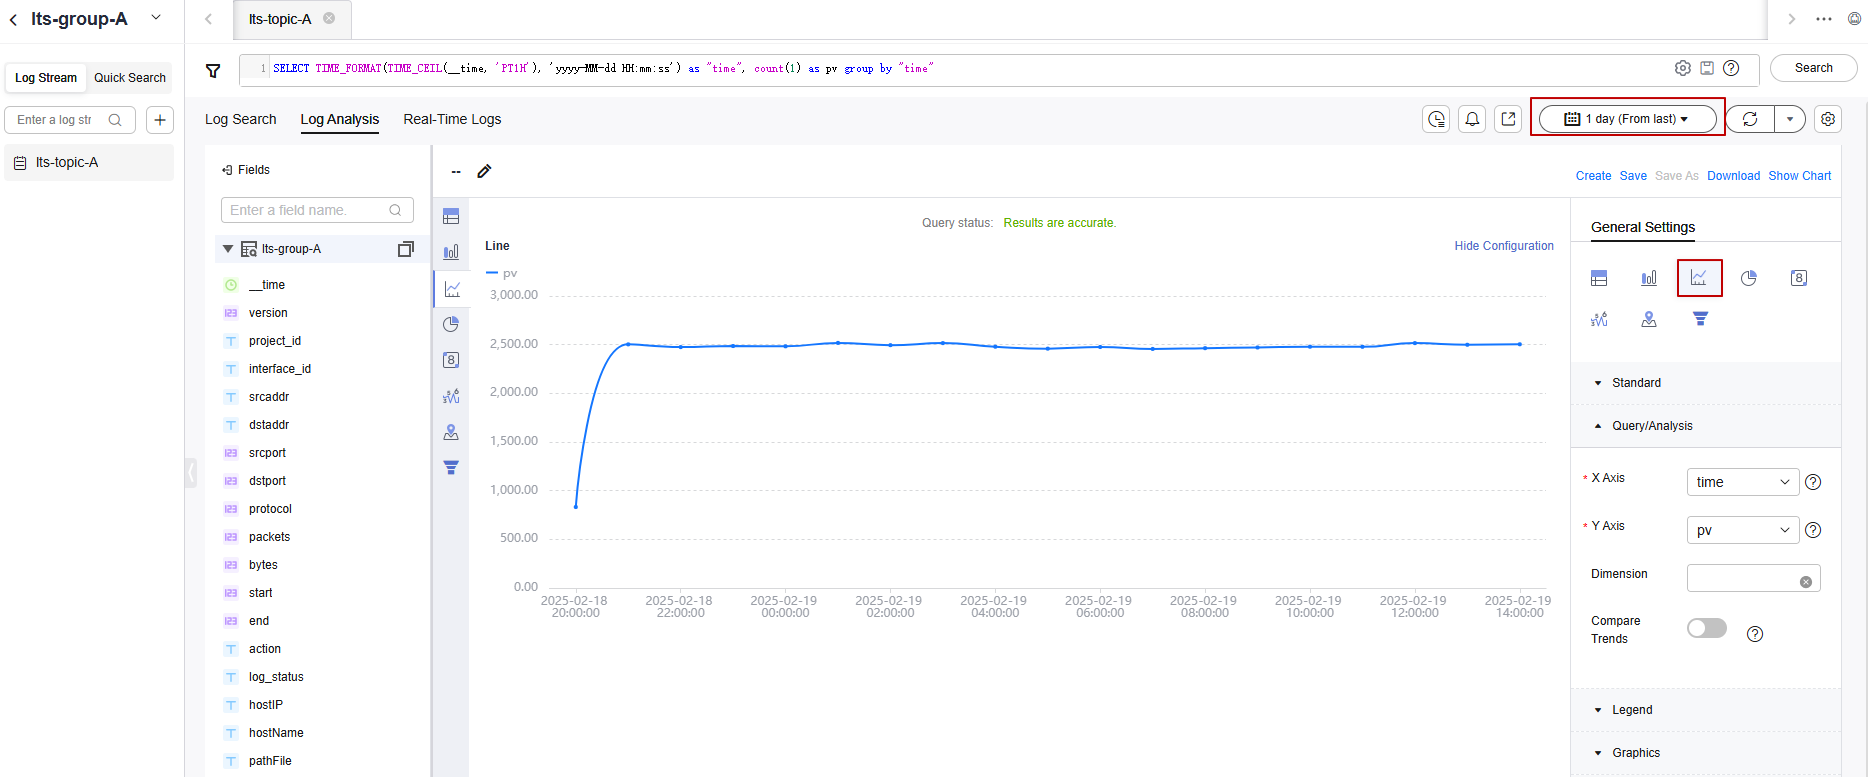
The following takes the traffic of ECS-01 every hour as an example.
SELECT TIME_FORMAT(TIME_CEIL(__time, 'PT1H'), 'yyyy-MM-dd HH:mm:ss') as "time", count(1) as pv group by "time"
- On the right of the page, configure the time and other information.
In this example, you can view the hourly traffic data within a day. For more information about the statistical charts, see Statistical Charts.
Figure 5 Traffic line chart
- On the Log Analysis tab, enter the required statement in the search box by referring to Using SQL Analysis Syntax to obtain the required logs.
- Visualize logs in dashboards. The dashboard is a real-time data visualization tool provided by LTS.
- Ingest VPC logs to LTS by referring to Ingesting VPC Logs to LTS.
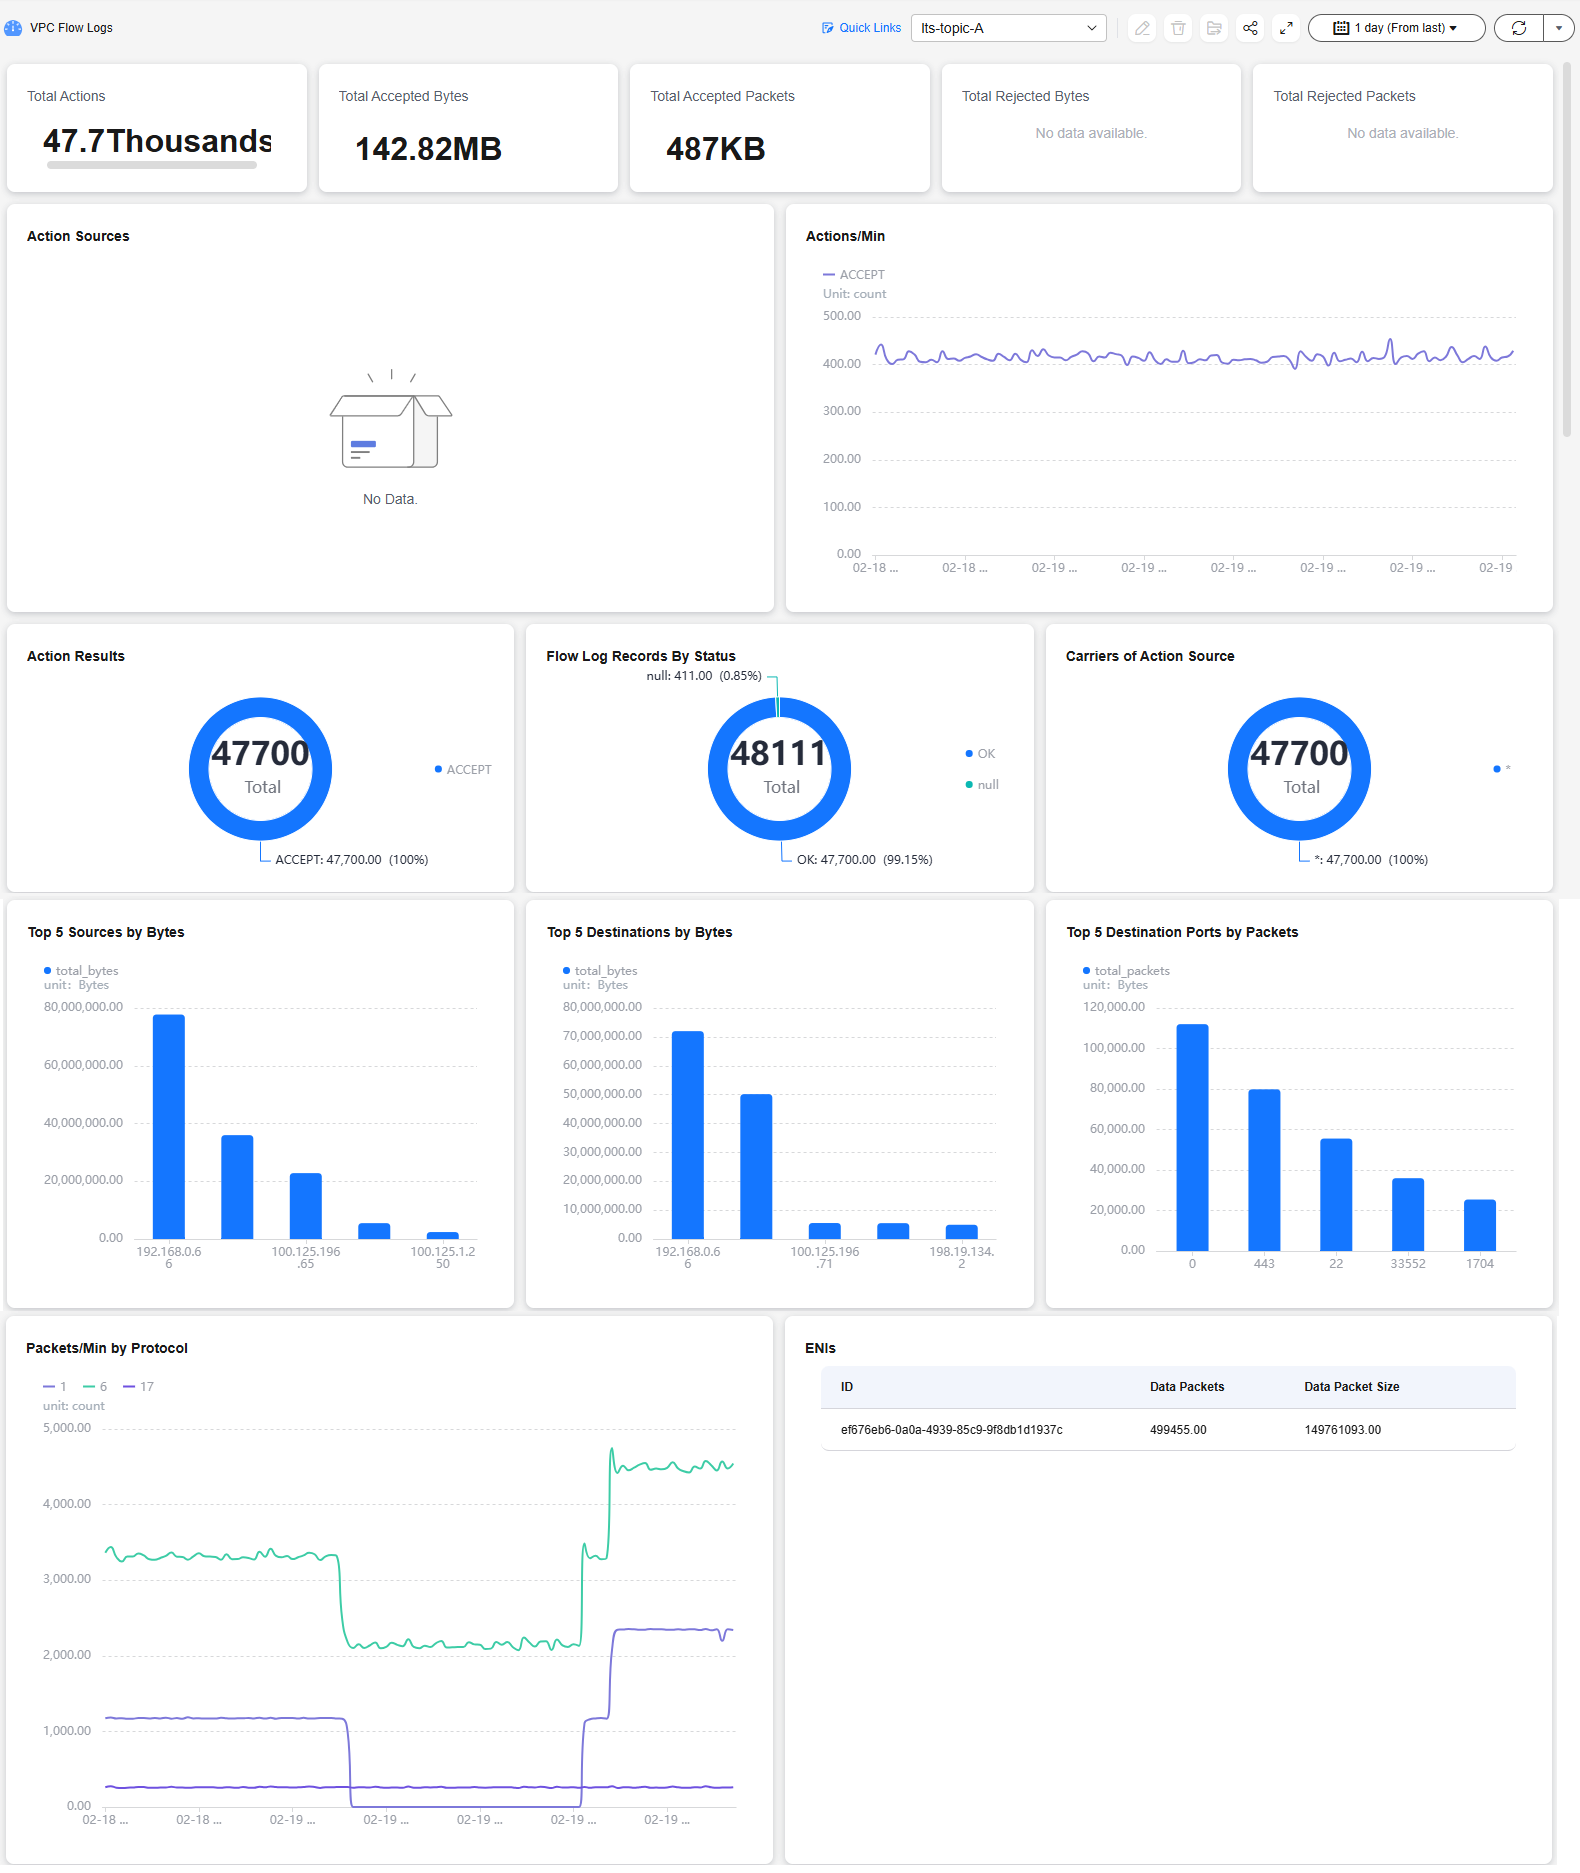
- After VPC logs are ingested, choose Dashboards > VPC dashboard templates > VPC Flow Logs on the LTS console.
Wait for a few minutes and view the log data. For more information about the dashboard, see VPC Dashboard Template.
Figure 6 VPC flow log dashboard
- Visualize logs in statistical charts. Statistical charts, such as tables, bar charts, and line charts, are rendered by LTS based on SQL query syntax.
What is your overall rating for this page?
Thank you very much for your feedback. We will continue working to improve the documentation.See the reply and handling status in My Cloud VOC.
For any further questions, feel free to contact us through the chatbot.
Chatbot


