
Run Logs (Old Version)
IoTDA can record the connections with devices and applications and report logs to Log Tank Service (LTS). LTS provides real-time query, massive log storage, log structuring, visualization, and analysis capabilities. It provides a free quota of 500 MB per month. When this quota is used up, you will be billed for any excess usage on a pay-per-use basis. For details, see What Is Log Tank Service?
Currently, only service run logs of MQTT devices can be recorded. For details, see the following table.
|
Service Type |
Service Flow |
|---|---|
|
Device status |
|
|
Device going offline |
|
|
Device message |
|
|
Device command |
|
|
Device property |
|
|
Device event |
|
|
Platform responding to a request for updating child device statuses |
|
|
Device downloading upgrade package |
|
|
Batch task |
|
|
Device self-registration |
|
|
Device authentication |
Custom device authentication result |
|
Field |
Description |
|---|---|
|
appId |
Application ID. |
|
deviceId |
Device ID. |
|
categoryName |
Log type: batch.task. |
|
operation |
Action. Set this parameter to the ID of a batch task. For details, see Create a Batch Task. |
|
request |
Request content in JSON format. { "task_type": "createDevices", / / Task type "package_id": "f2303267a6e8f0053037c2a9", // Software/Firmware upgrade package "package_ids": ["65f3ebe2682b9f4bcc38baad"] // Software/Firmware upgrade package }
NOTE:
When the batch task type is softwareUpgrade or firmwareUpgrade, the package_id and package_ids parameters are supported. |
|
response |
Response content in JSON format. Success: { "output" : "xxxxxxxxxxxx" } Failure: { "error" : { "error_code" : "IOTDA.XXXXX", "error_msg" : "XXXXX." } } |
|
status |
Execution result. Subtask status. Options: Success, Fail, Stopped, or Removed. |
|
Field |
Description |
|---|---|
|
recordTime |
Log collection time. The time format is yyyy-MM-dd'T'HH:mm:ss,SSS'Z'. Example: 2020-06-16T09:24:45,708Z |
|
deviceId |
Device ID. |
|
requestId |
Request ID. |
|
categoryName |
Options: device.status device.message device.command device.property device.event device.auth device.provisioning |
|
operation |
Operation name. Example: API URL or MQTT message topic. |
|
request |
Request parameter of an operation. Example: API request body. |
|
response |
Operation result. Example: API response body or error information. |
|
result |
Operation status code. |
Procedure
- Access the IoTDA service page and click Access Console. Click the target instance card.
- In the navigation pane, choose , and click Configure Run Log.
Figure 1 Run log - Old version configuration

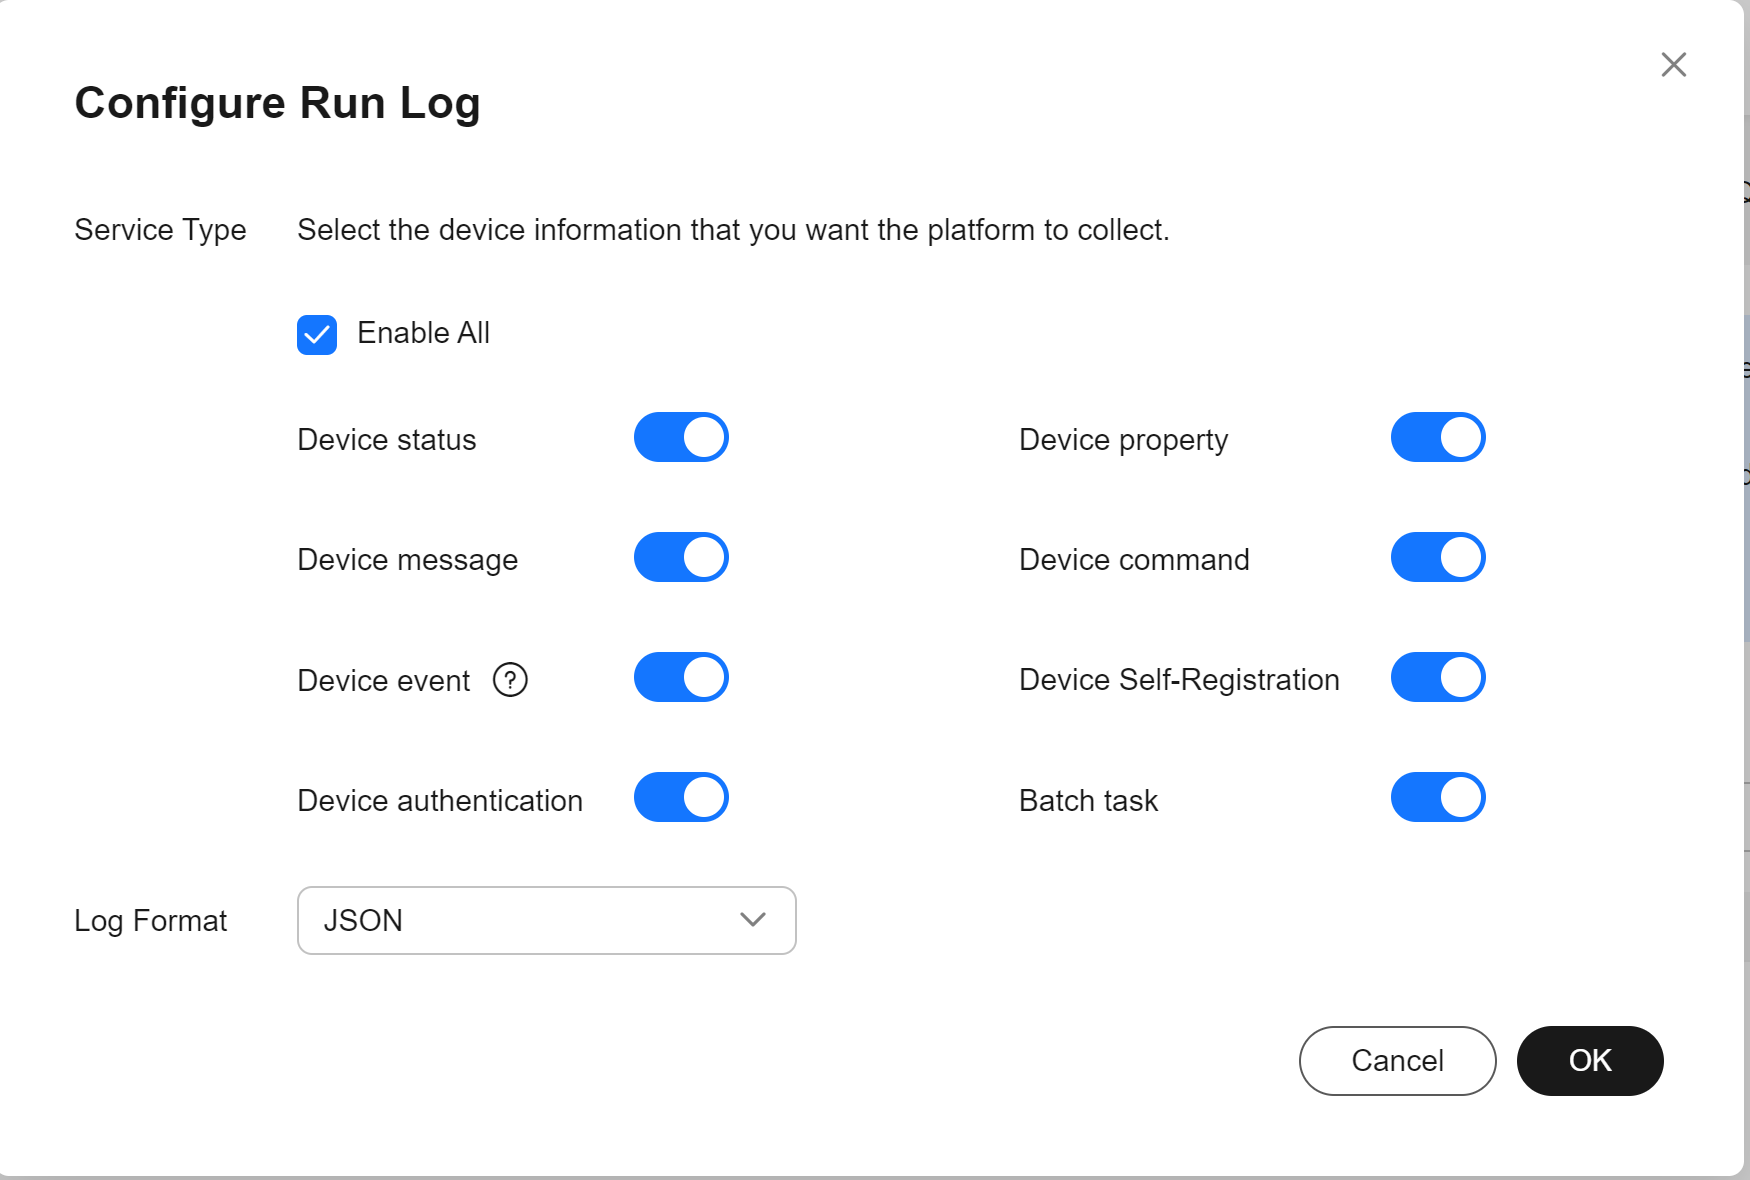
- On the displayed dialog box, select the service type for data collection and click OK.
Figure 2 Run log - Log switch of old version configuration
- Create a run log forwarding rule to forward the collected log data to other cloud services, so that you can view and process it. You are advised to forward log data to LTS. The following uses LTS as an example.
- In the navigation pane, choose , and click Create Rule.
- Configure parameters by referring to the following table, and click Create Rule.
Table 4 Creating a rule Parameter
Description
Rule Name
Specify the name of a rule to create.
Description
Describe the rule.
Data Source
Select Run log.
Trigger
After the data source is selected, the platform automatically matches the trigger event.
Resource Space
You can select a single resource space or all resource spaces.
- Click the Set Forwarding Target tab, and then click Add to set a forwarding target.
Table 5 Setting the forwarding target Parameter
Description
Forwarding Target
Select Log Tank Service (LTS).
Region
Currently, log data can be forwarded only to LTS in the same region.
Log Group/log Stream
Select a log group and log stream of LTS. If no log group or log stream is available, create them by referring to Managing Log Groups and Managing Log Streams.

Logs are retained in the log group for 7 days by default. Logs that have been stored for more than the retention period will be automatically deleted. For long-term storage, you can transfer logs to Object Storage Service (OBS) buckets. For details, see Transferring Logs to OBS.
LTS provides a free quota of 500 MB per month. By default, it continues to collect logs when the quota is used up. You will be billed for the excess usage on a pay-per-use basis. You can log in to the LTS console and choose Configuration Center to disable this function.
- Click OK, and then click Enable Rule to forward run logs to LTS.
- Log in to the LTS console and choose Log Management.
- Select the log group and log stream created in 3 to view the logs reported by IoTDA. Search for raw and target logs by referring to Log Search. For example, search for logs by device ID and service type.
Figure 3 Run logs - Checking the log list
 Figure 4 Run logs - Searching for run logs
- On the log stream details page, click the Log Analysis tab. On the log structuring page that is displayed, select JSON.
Figure 5 Run logs - Log analysis

- Select a sample log that contains time, device ID, request ID, service type, operation, request parameter, result information, and execution status. Click the button of intelligent extraction to modify the field names, for example, recordTime, requestId, deviceId, categoryName, operation, request, response and result. Change the field type to string. Click Save to complete the log structuring configuration. For details, see Structuring Logs.
Figure 6 Run logs - Configuring log structuring

- After the raw logs are structured, the service will respond. On the Log Management page, select the log group and log stream created in 3, and click the button for log analysis to check the structured target logs. You can query logs using SQL statements. For example, to query logs by device ID and service type, run select * where deviceId = '{{deviceId}}' and categoryName = 'device.status'.
Figure 7 Run logs - Log analysis and search

Feedback
Was this page helpful?
Provide feedbackThank you very much for your feedback. We will continue working to improve the documentation.See the reply and handling status in My Cloud VOC.
For any further questions, feel free to contact us through the chatbot.
Chatbot


