Using SQL Probes of DWS
DMS provides SQL probes that can be used to trace and diagnose the execution of SQL statements in real time. You can upload and verify SQL probes, execute probe tasks in one click, and periodically execute probe tasks. Alarms can be reported for SQL probes that have timed out.
Notes and Constraints
- The SQL probe is supported only in 8.1.1.300 and later versions. To use it in earlier versions, contact technical support.
- Only SELECT statements can be used as SQL probes.
- Up to 20 SQL probes can be configured.
- To create an SQL probe, you must have the DWS FullAccess permission.
- To enable the SQL probe function, choose Monitoring Settings. On the Monitoring Collection page, enableSQL Probe. For details, see Monitoring Collection. The default collection frequency is 30s.
Adding a SQL Probe
- Log in to the DWS console.
- Choose Dedicated Clusters > Clusters and locate the cluster to be monitored.
- In the Operation column of the target cluster, click Monitoring Panel.
- In the navigation pane, choose Tools > SQL Probes. Click Add SQL Probe.
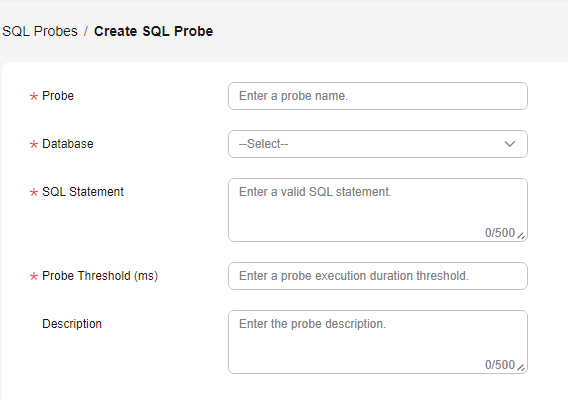
- Configure SQL probe parameters. For details, see Table 1.

Table 1 SQL probe parameters Parameter
Description
Probe
Name of the probe to be executed
Database
Database where the probe SQL statement is to be executed
SQL Statement
Probe SQL statement to be executed. (Only SELECT statements are allowed).
Probe Threshold (ms)
Probe SQL execution alarm threshold
Description
Probe SQL statement description
- Enter the SQL probe information and click OK. In the dialog box that is displayed, click OK to save the new SQL probe.
SQL Probe Management Operations
- Log in to the DWS console.
- Choose Dedicated Clusters > Clusters and locate the cluster to be monitored.
- In the Operation column of the target cluster, click Monitoring Panel. The database monitoring page is displayed.
- In the navigation pane on the left, choose Utilities > SQL Probes. You can enable, disable, modify, execute, and delete SQL probes. The following table lists the operations.
Table 2 SQL probe management operations Operation
Description
Enable
Click Enable in the Operation column of a SQL probe to enable the probe.
Disable
Click Disable in the Operation column of a SQL probe to disable the probe.
Modify
Click Modify in the Operation column of a SQL probe to modify the probe.
Run
In the probe list, select a probe and click Run. The system will execute the selected probe and update information about the probe.
Delete
Click Delete in the Operation column of a SQL probe. In the displayed dialog box, enter DELETE or click Auto Enter.
- Click OK.
Feedback
Was this page helpful?
Provide feedbackThank you very much for your feedback. We will continue working to improve the documentation.See the reply and handling status in My Cloud VOC.
For any further questions, feel free to contact us through the chatbot.
Chatbot


