Help Center/
Data Warehouse Service /
User Guide/
DWS Cluster O&M/
Viewing DWS Cluster Monitoring Information on the Monitoring Panel (DMS)/
Enabling and Disabling DWS Monitoring Metrics
Updated on 2025-11-03 GMT+08:00
Enabling and Disabling DWS Monitoring Metrics
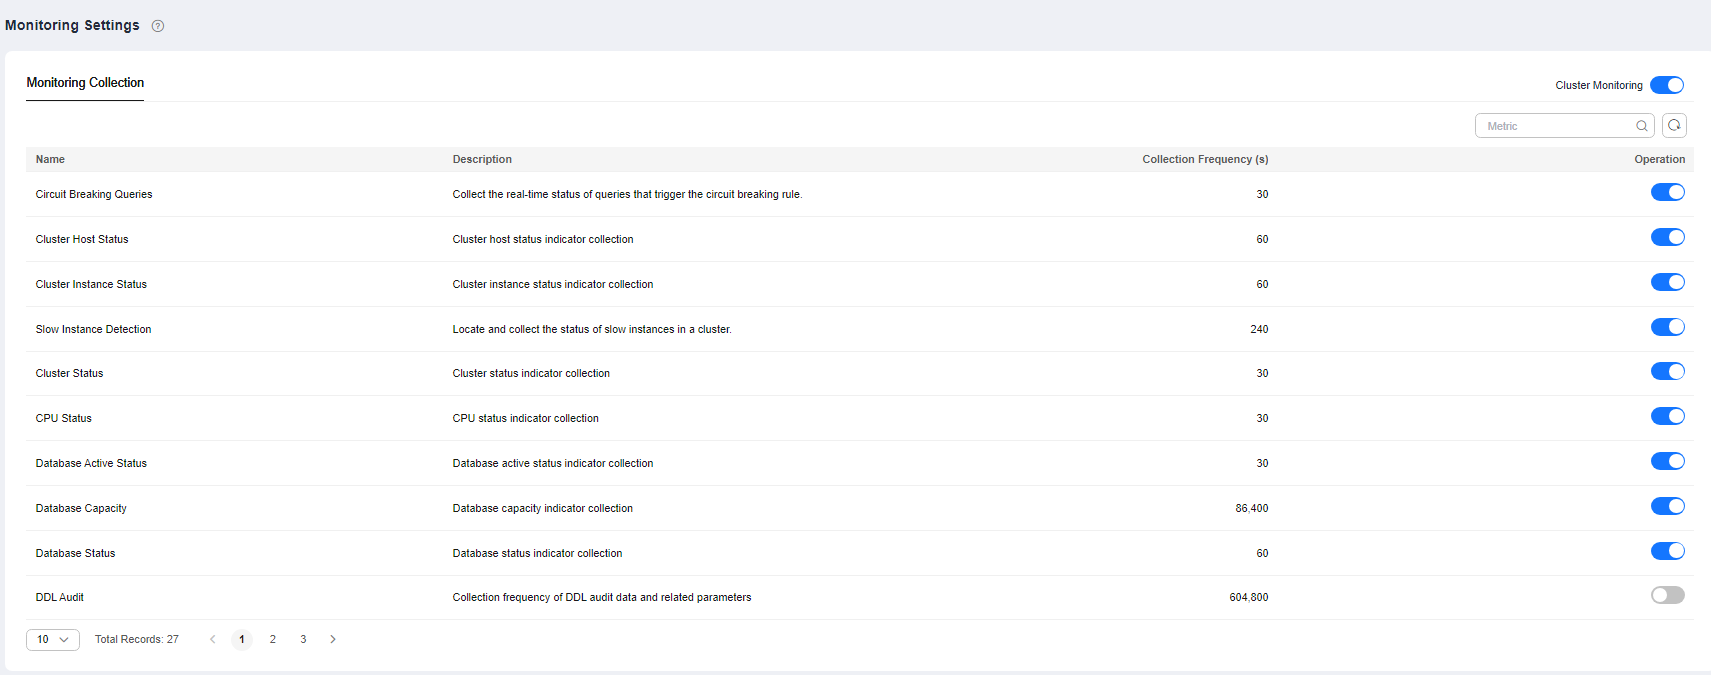
The Monitoring Settings page displays the collection frequencies of monitoring metrics. You can choose whether to enable monitoring metrics.
Notes and Constraints
- The cluster monitoring function is enabled by default.
- Disable the function if the cluster is being recovered. Enable the function when the fault is rectified.
- When a node in the cluster is powered off or the management IP address of the cluster is unavailable, the cluster monitoring switch and the button for configuring cluster indicator collection are unavailable.
Monitoring Collection
- Log in to the DWS console.
- Choose Dedicated Clusters > Clusters and locate the cluster to be monitored.
- In the Operation column of the target cluster, click Monitoring Panel.
- In the navigation pane on the left, choose Monitoring Settings > Monitoring Collection. On this page, you can disable the collection of monitoring metrics.

Feedback
Was this page helpful?
Provide feedbackThank you very much for your feedback. We will continue working to improve the documentation.See the reply and handling status in My Cloud VOC.
The system is busy. Please try again later.
For any further questions, feel free to contact us through the chatbot.
Chatbot


