Diagnosing SQL Statements of DWS
DWS provides a tool for diagnosing SQL query statements. This tool provides alarm information and execution plan analysis for the statements, and identifies bottlenecks in statement execution. It can help you optimize SQL query performance, improve database query efficiency, reduce system resource consumption, and improve the response speed.
Prerequisites
To enable SQL diagnosis, choose Monitoring Settings. On the Monitoring Collection page, enable Historical Query Monitoring. For details, see Monitoring Collection.
Viewing SQL Diagnosis
- Log in to the DWS console.
- Choose Dedicated Clusters > Clusters and locate the cluster to be monitored.
- In the Operation column of the target cluster, click Monitoring Panel.
- In the navigation pane on the left, choose Utilities > SQL Diagnosis.
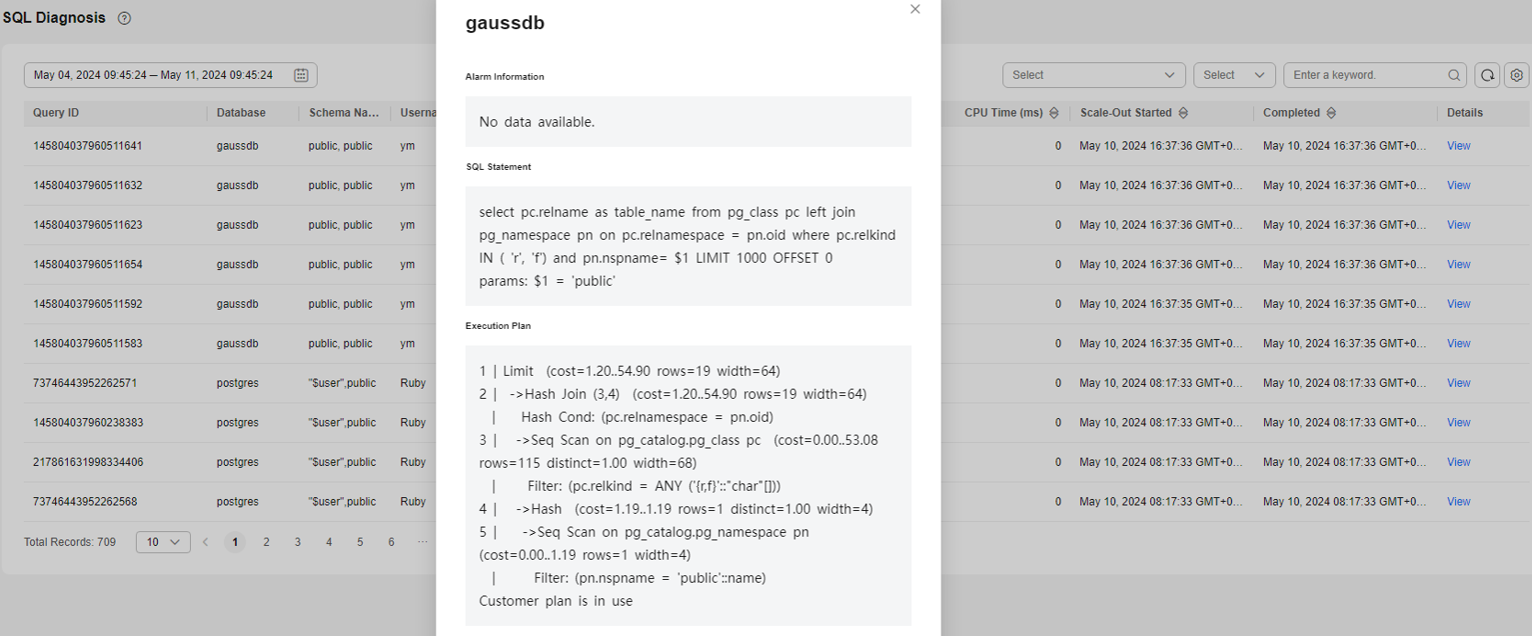
- On the SQL Diagnosis page, you can view the SQL diagnosis information. For details about the metrics, see Table 1.

Table 1 SQL diagnosis metrics Metric Name
Description
Query ID
Internal query_ID used for statement execution
Database
Database name
Schema Name
Name of the schema
Username
Username
Client
Name of the application that is connected to the backend
Client IP Address
IP address of the client connected to the backend. If this column is null, it indicates that the client is connected via a Unix socket on the server machine or that it is an internal process, such as autovacuum.
Running Time (ms)
Execution time of the statement, in milliseconds
CPU Time (ms)
Total CPU time of a statement across all DNs, in milliseconds
Start Time
Time when the statement starts to be executed
Completion Time
End time of statement execution
Details
Click View to view the detailed diagnosis result of the SQL statement. The result contains the following information:
- Alarm information about the SQL statement
- SQL statement
- Execution plan of the SQL statement
Setting GUC Parameters
GUC parameters related to SQL diagnosis are as follows. For details, see "GUC Parameters" in the Data Warehouse Service Developer Guide.
|
GUC Parameter Name |
Value Range |
Default Value |
Expected DMS Value |
Function |
|---|---|---|---|---|
|
enable_resource_track |
Boolean |
on |
on (for reference only) |
Specifies whether to enable real-time resource monitoring. If this parameter is enabled without other GUC-related parameters correctly configured, real-time resource consumption cannot be recorded. |
|
resource_track_cost |
Integer, ranging from -1 to INT_MAX |
0 |
0 (for reference only) |
Specifies the minimum execution cost of statement resource monitoring for the current session. This parameter is valid only when enable_resource_track is on. If this parameter is set to a small value, more statements will be recorded, causing record expansion and affecting cluster performance. |
|
resource_track_level |
Enumeration |
query |
query (for reference only) |
Specifies the resource monitoring level for the current session. This parameter is valid only when enable_resource_track is on. If the resource monitoring is set to operator-level, performance will be greatly affected. |
|
resource_track_duration |
Integer, ranging from 0 to INT_MAX, in seconds |
60 |
0 (for reference only) |
Specifies the minimum statement execution time that determines whether information about jobs of a statement recorded in the real-time view will be dumped to a historical view after the statement is executed. That is, only statements whose execution time exceeds the specified time are recorded in the historical view. This parameter is valid only when enable_resource_track is on. If this parameter is set to a small value, the batch processing mechanism for dumping kernel statements becomes invalid, affecting the kernel performance. |
|
topsql_retention_time |
The value is an integer ranging from 0 to 3650. The unit is day. |
30 |
14 (for reference only) |
Specifies the aging time of pgxc_wlm_session_info data in the view. If this parameter is set to 0, data will not be aged, which will cause storage expansion. |
|
enable_resource_record |
Boolean |
on |
on (for reference only) |
Specifies whether to enable the archiving function for resource monitoring records. When this function is enabled, records in the history views (GS_WLM_SESSION_HISTORY and GS_WLM_OPERATOR_HISTORY) are archived to the info views (GS_WLM_SESSION_INFO and GS_WLM_OPERATOR_INFO) every 3 minutes. After the archiving, records in the history views are deleted. When this parameter is enabled, you are advised to set topsql_retention_time properly to configure the aging time. Otherwise, data in the GS_WLM_SESSION_INFO or GS_WLM_OPERATOR_INFO table will expand. |
FAQs
Symptom
The execution of SQL statements takes a long time, resulting in great resource consumption.
Troubleshooting
If the execution efficiency of SQL statements is low, optimization suggestions are provided after the kernel executes the SQL statements. You can query the execution history to retrieve optimization suggestions and further optimize SQL statements to improve query efficiency.
Procedure
- On the SQL Diagnosis page, select a time period that does not seem right.
- Search for SQL statements based on indicators such as the start time, end time, and running duration of the statement.
- Click View to view SQL optimization suggestions.
- Optimize the SQL statement based on suggestions.
Feedback
Was this page helpful?
Provide feedbackThank you very much for your feedback. We will continue working to improve the documentation.See the reply and handling status in My Cloud VOC.
For any further questions, feel free to contact us through the chatbot.
Chatbot


