DWS_2000000031 Active Session Usage in a DWS Cluster Exceeds the Threshold
Alarm Description
The DMS alarm module generates an alarm if the active session usage in the cluster exceeds the set threshold within a specific time frame and the suppression conditions are not met. The alarm is cleared when the DMS alarm module detects that the active session usage in the cluster is below the threshold.
Alarm Attributes
|
Alarm ID |
Alarm Category |
Alarm Severity |
Alarm Type |
Service Type |
Auto Cleared |
|---|---|---|---|---|---|
|
DWS_2000000031 |
Tenant plane |
> 90 (Critical); > 80 (Major) |
Service alarm |
DWS |
Yes |
Alarm Changes
|
Change Type |
Change Version |
Description |
Reason for Change |
|---|---|---|---|
|
New |
8.2.1.230 |
New alarm |
New alarm |
Alarm Parameters
|
Type |
Parameter |
Description |
|---|---|---|
|
Fault Location |
Cluster name |
Cluster for which the alarm is generated. |
|
Tenant name |
Name of the tenant to which the cluster belongs. |
|
|
Alarm level |
Severity of the alarm. |
|
|
Additional Information |
Resource ID |
ID of the cluster for which the alarm is generated. |
|
Resource name |
Cluster for which the alarm is generated. |
|
|
First_alarm_time |
First occurrence event of an alarm, including the alarm threshold and current value. |
Impact on the System
The number of available sessions is insufficient, affecting service execution.
Possible Causes
The value of max_active_statements is too small.
Procedure
- Log in to the DWS console.
- Choose Dedicated Clusters > Clusters.
- In the cluster list, locate the desired cluster and click the cluster name. The Cluster Information page is displayed.
- In the navigation pane, choose Parameter Modifications. On the Parameters tab page, search for and modify the following parameters, and click Save.
- In the Common Configuration area, enter resource_track_duration in the search box to find the parameter and set both Value for CN and Value for DN to 1.
Figure 1 Modifying the resource_track_duration parameter

- In the Common Configuration area, enter topsql_retention_time in the search box to find the parameter and set both Value for CN and Value for DN to 14. Alternatively, you can set them as needed.
Figure 2 Modifying the topsql_retention_time parameter

- In the Common Configuration area, enter resource_track_duration in the search box to find the parameter and set both Value for CN and Value for DN to 1.
- Find the SQL statement that causes the deadlock.
- Method 1
- Return to the Dedicated Clusters page. Locate your desired cluster and click Monitoring Panel in the Operation column.
- In the navigation pane on the left, choose Monitoring > Historical Queries. In the upper right corner of the history query page, select Reason and the keyword deadlock detected.
- Find the SQL statements that cause the deadlock. Sort them chronologically to pinpoint the most recent statement causing the deadlock.
Figure 3 SQL statement 1 causing the deadlock

- Method 2
- Return to the console. In the navigation pane on the left, choose Monitoring > Optimization Diagnosis.
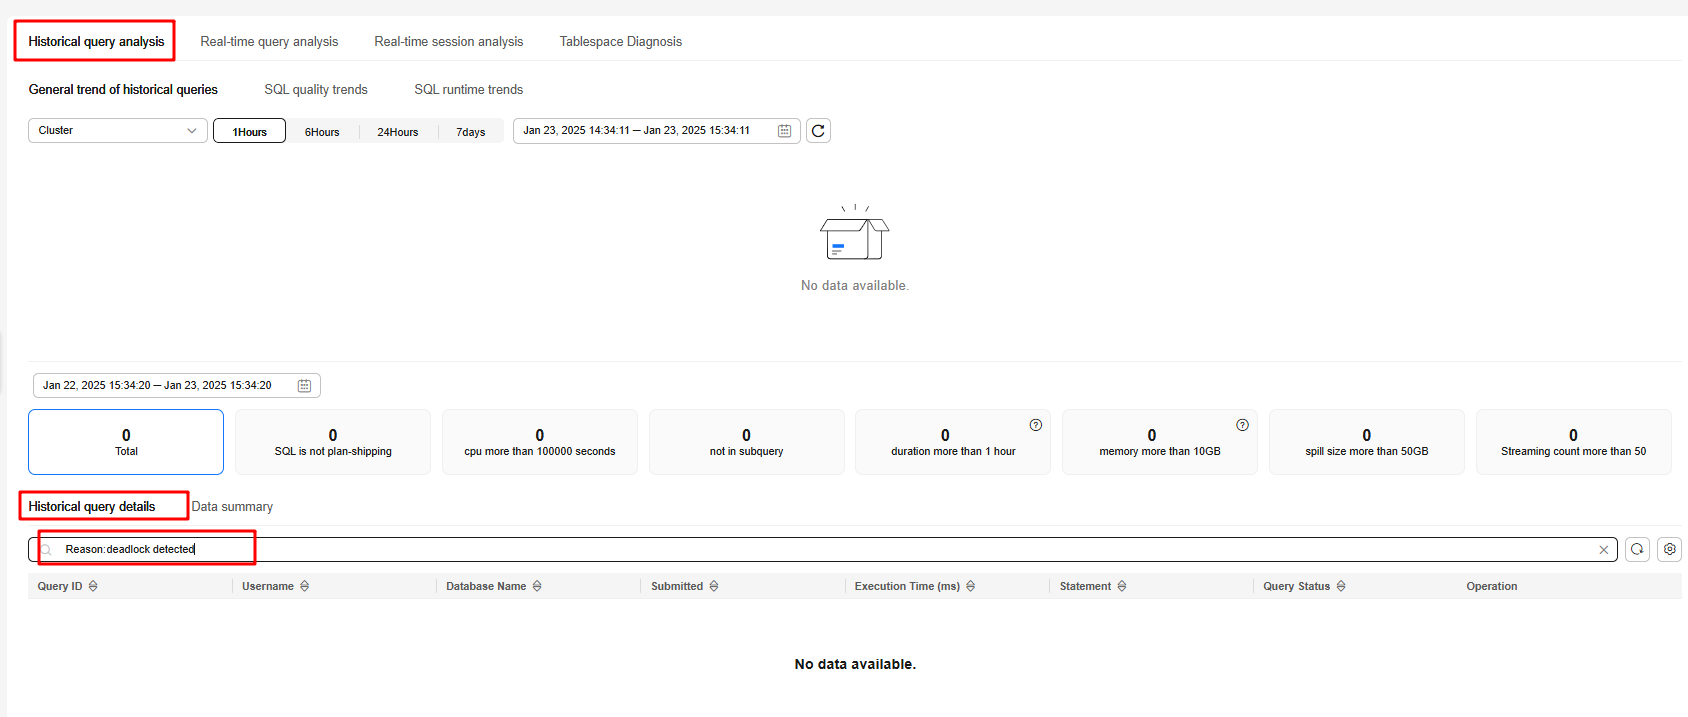
- On the displayed General trend of historical queries sub-tab of Historical query analysis, select Reason and the keyword deadlock detected.
- Find the SQL statements that cause the deadlock. Sort them chronologically to pinpoint the most recent statement causing the deadlock.
Figure 4 SQL statement 2 causing the deadlock

- Solution to the deadlock issue: Deadlocks will be automatically detected in Huawei Cloud Stack 8.2.1 or later clusters. The detection will be delayed for 1 second. The lock will be automatically released when a deadlock is detected.
Alarm Clearance
This alarm is automatically cleared after the fault is rectified.
Related Information
None
Feedback
Was this page helpful?
Provide feedbackThank you very much for your feedback. We will continue working to improve the documentation.See the reply and handling status in My Cloud VOC.
For any further questions, feel free to contact us through the chatbot.
Chatbot


