Configuring and Viewing Function Invocation Logs
FunctionGraph is interconnected with LTS, allowing you to view function logs without the need for any configurations.
On the FunctionGraph console, view function logs in the following ways:
- Viewing logs on the execution result page
After creating a function, test it and view test logs on the execution result page. For details, see Debugging Functions Online.
The execution result page displays a maximum of 2 KB logs. To view more logs of the function, go to the Logs tab page.
- Viewing logs on the Logs tab page
On the function details page, choose Monitoring > Logs to query log information. For details, see Using LTS to Manage Function Logs.
Configuring Log Groups and Log Streams, and Viewing Function Logs
You can bind a log group and log stream to a function to store its invocation logs. By default, the logs are stored in the log stream automatically created for the function. For details, see Using LTS to Manage Function Logs.
Procedure
- Log in to the FunctionGraph console. In the navigation pane, choose Functions > Function List.
- Click the name of the desired function.
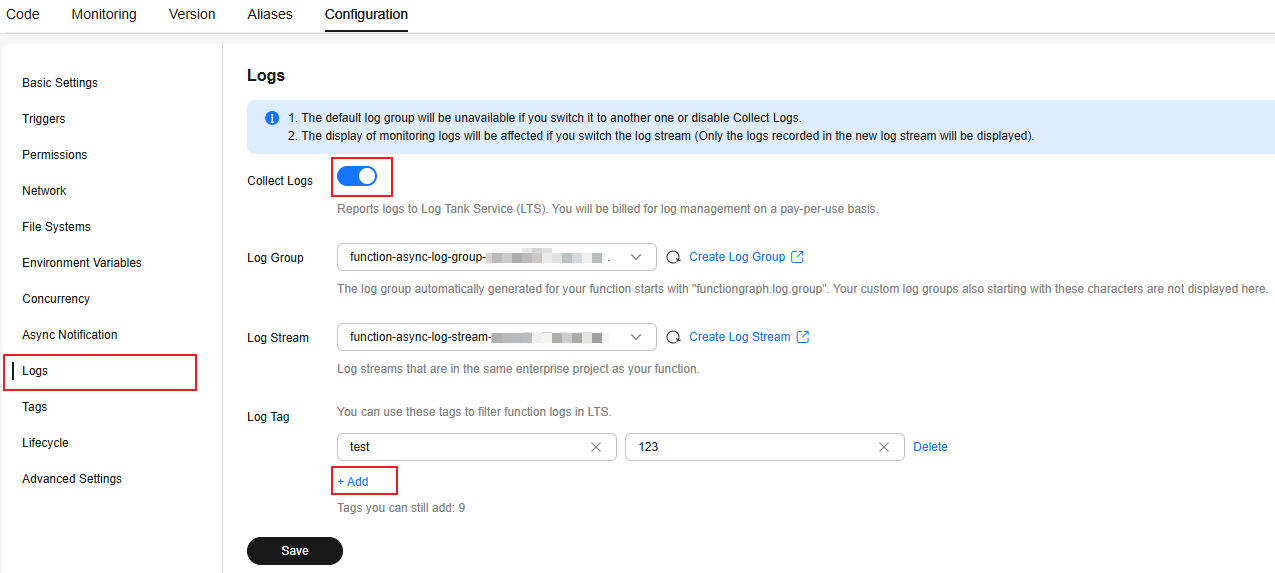
- Choose Configuration > Log, and configure log collection according to Table 1.
Table 1 Log configuration parameters Parameter
Description
Collect Logs
Enabled by default in FunctionGraph V2. This feature is unavailable for FunctionGraph V1.
Log Group
Select a log group for the function. The default log group functiongraph.log.group.xxx cannot be selected. For details about how to create a log group, see Managing Log Groups.
By default, the log group (starting with functiongraph) automatically generated by FunctionGraph is selected.
Log Stream
Select a log stream in the specified log group. For details about how to create a log group, see Managing Log Streams.
By default, the log stream (starting with the function name) automatically generated for the function is selected.
- Click Save.

You can change the log stream if needed.
- Click the Code tab and click Test to execute the function.
- After the function is executed, choose Monitoring > Logs to view the function logs.
- As shown in Figure 1, logs of the function are generated in the specified log group and log stream.
- If no custom log group and log stream are specified, the default log group (starting with functiongraph) and log stream are displayed.
- The following figure shows two successful requests. The request at the bottom took 13.100 ms, including the cold start time. The request at the top took only 1.671 ms, because no cold start was involved. Figure 2 Request

Log Tag
You can configure tags to report logs to LTS when a function is executed. You can filter function logs by tag.
- When creating a function, you can click Collect Logs in the Advanced Settings area to add log tags. If the function has been created, go to 2.
- On the function details page, choose Configuration > Logs, enable Collect Logs, and select a log group and log stream.
- Click Add, enter the tag key and value, and click Save. A maximum of 10 tags can be added.
Table 2 Log tag description Parameter
Description
Tag key
Cannot be left blank. The value can contain a maximum of 64 characters, including only digits, letters, underscores (_), and hyphens (-).
Tag value
Figure 3 Adding a log tag
- Click the Code tab, configure the test event, and click Test. Wait until the function execution is complete.
- Choose Monitoring > Logs. On the Request List page, view the function request records. (Log reporting may be delayed. Please wait for a few minutes.)
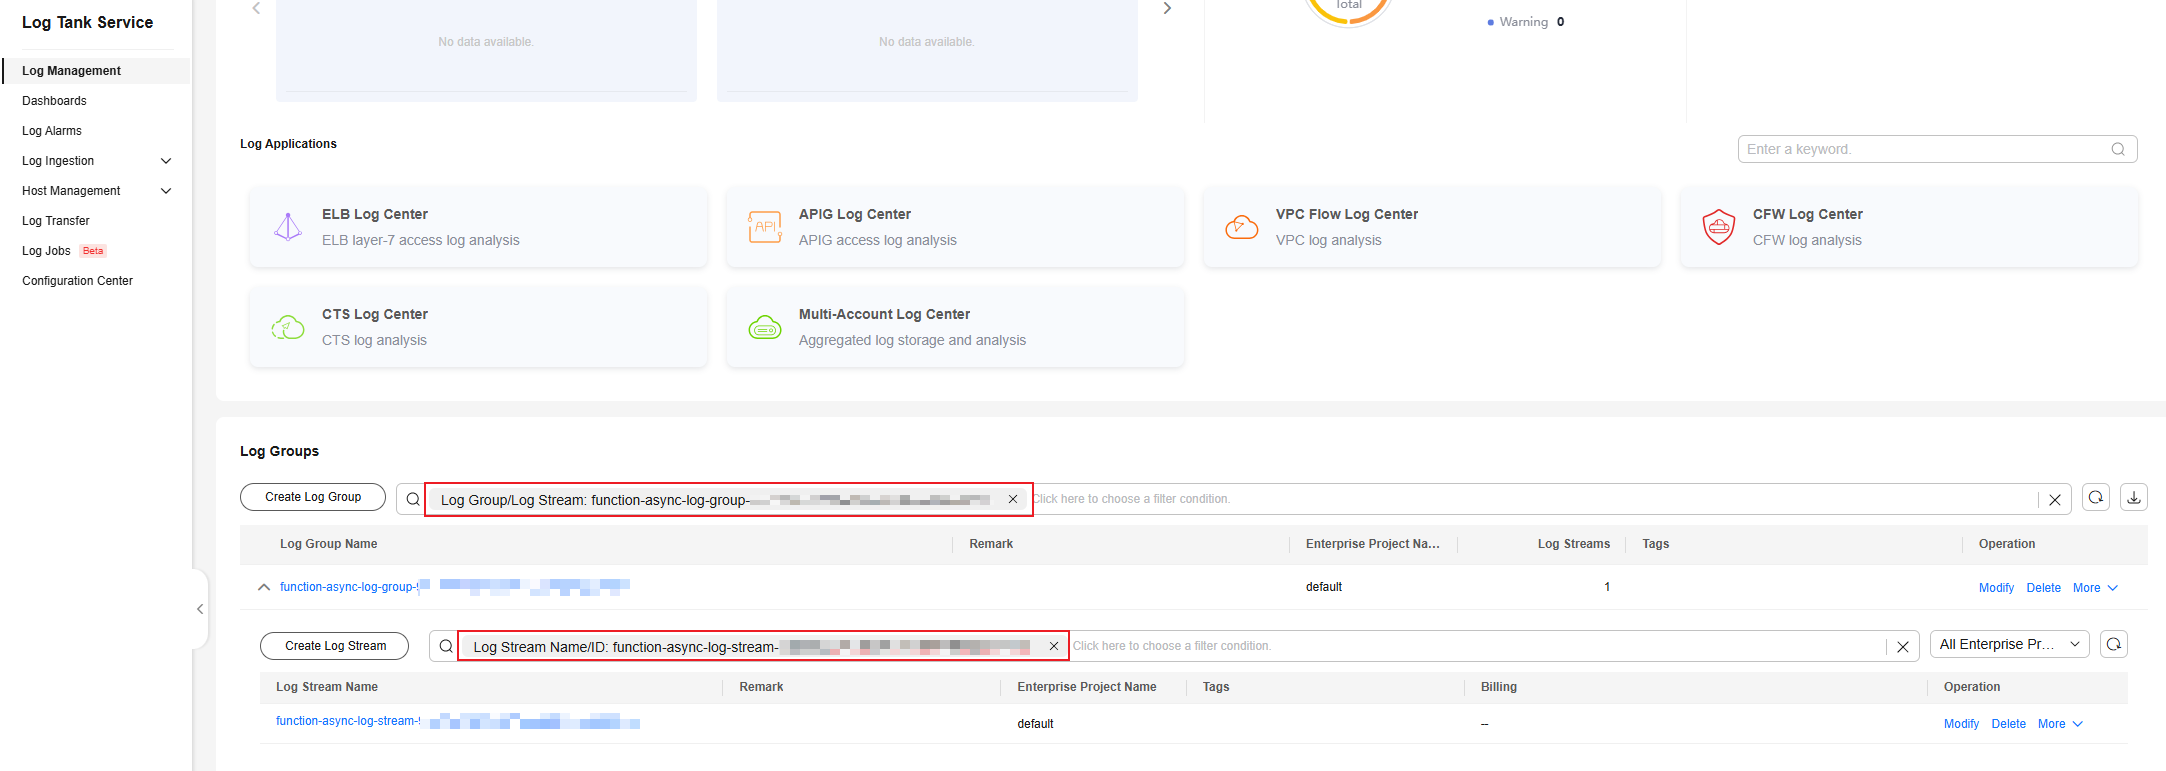
- Log in to the LTS console. In the navigation pane, choose Log Management. Set the filter criteria to search for the log group and stream. Click the log stream name to go to the details page. Figure 4 Searching for a log stream

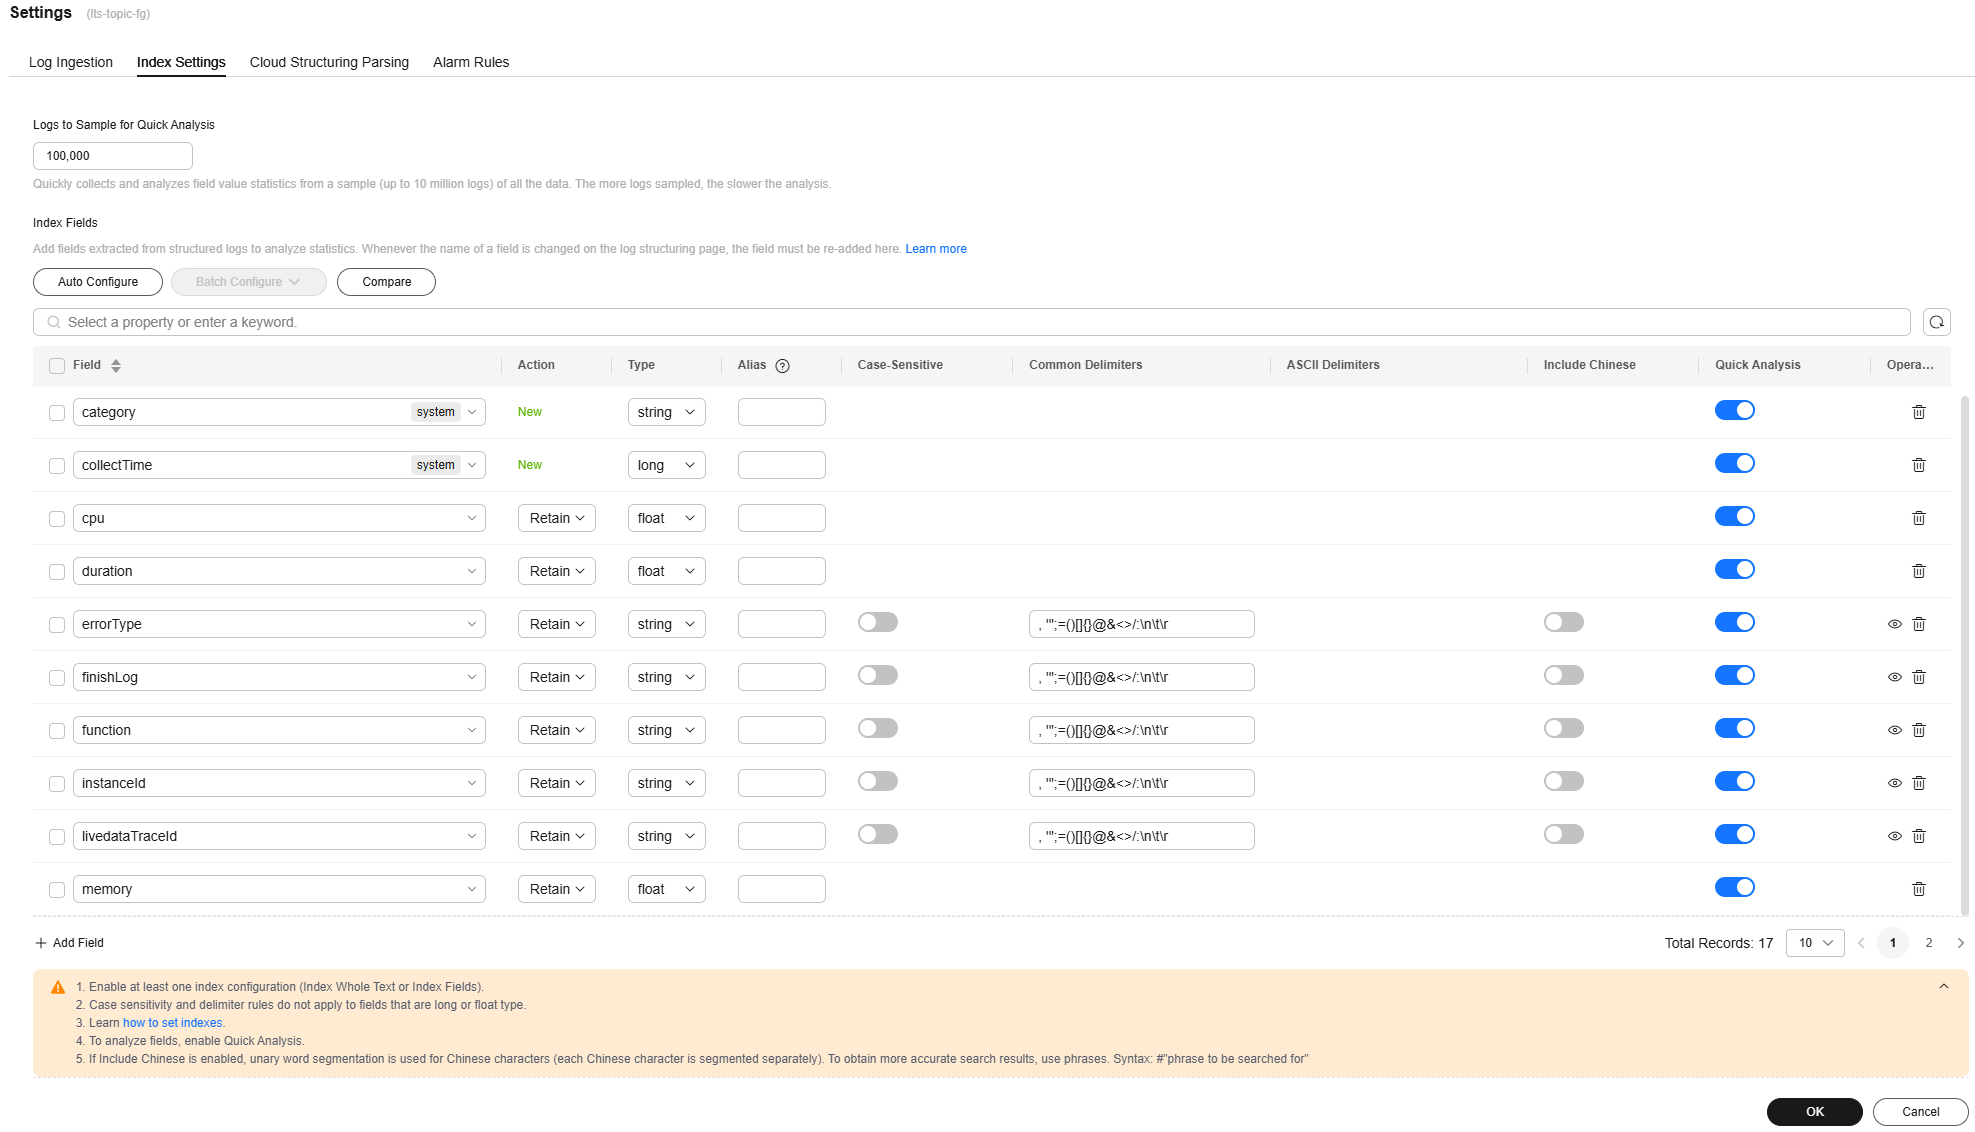
- On the log stream details page, click Log Settings. On the Index Settings panel, click Add Field to add the log tag key added to the function. For details about how to set indexes, see Configuring Log Indexing. Click OK.
- Return to the log stream details page, enter the log tag key and value configured for the function in the search box to view the matched logs.
Using LTS to Manage Function Logs
You can enable LTS to better manage function logs. After you enable LTS, FunctionGraph automatically creates a log group starting with functiongraph. When you create a function, a log stream starting with the function name is generated.
You can also bind a log group and log stream to a function to store its invocation logs. For details, see Configuring Log Groups and Log Streams, and Viewing Function Logs.
Constraints:
- By default, 20 log streams are created, which cannot be customized. On the Logs tab page of the function, press F12 to find out the log stream ID of the query API, and then locate the corresponding log stream ID in LTS.

- Deleting a function log group by mistake on the LTS console will not be detected by FunctionGraph, and the historical log data can no longer be retrieved. To use a log group, modify the function description and save the changes. A new log group will be created.
- Max. 10 MB logs can be retained for common instances during initialization. When this limit is reached, the latest logs replace the old ones.
- Enable LTS.
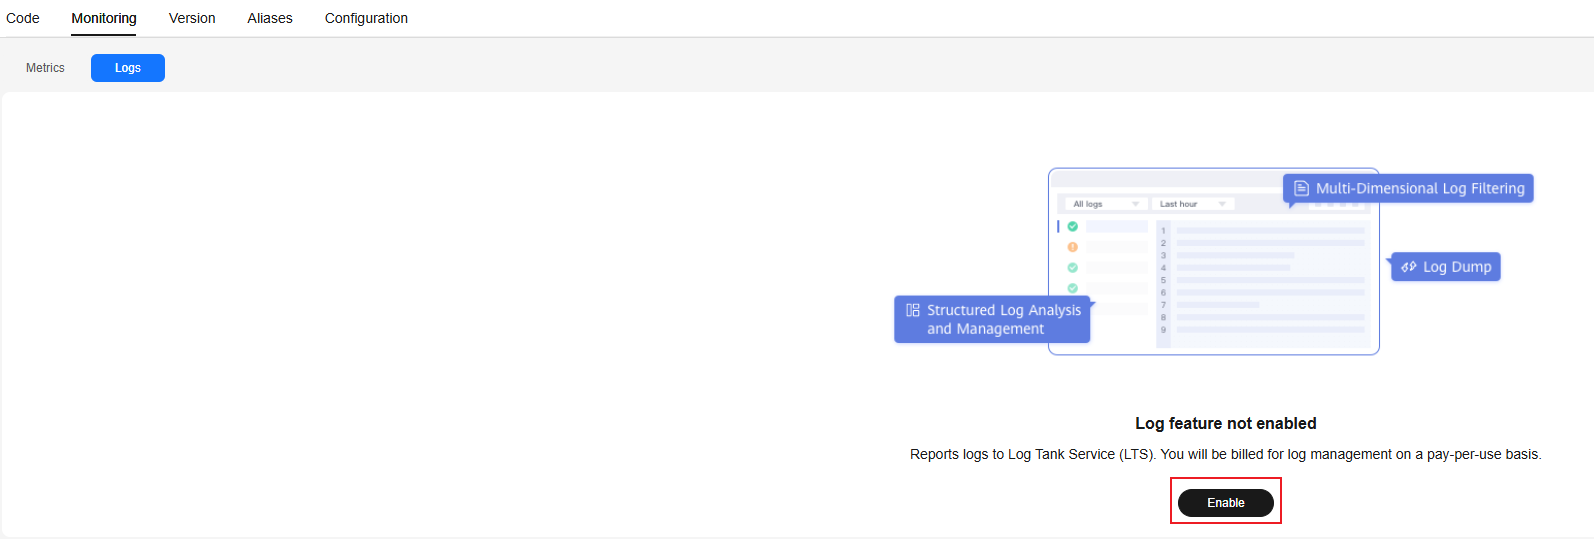
On the Logs tab, click Enable. The Logs page is displayed. Click Collect Logs.
Figure 5 Enabling logging
- Set filter criteria.
- Request List: Filter requests by request ID, result (success or failure), duration, actual memory or cause (initialization failed, load failed, system error, timed out, out of memory, out of disk space, or code error).
Before using query fields, configure them in LTS. For details, see Configuring Log Filtering Fields for a Function.
- Request Log: Filter logs by keyword, request ID, or instance ID.
Table 3 Invocation result Result
Description
Execution successful
Log printed when a function is successfully executed.
Execution failed
Log printed when a function fails to be executed due to invocation timeout, memory or disk threshold exceeded, or code errors.
To view the logs about invocation timeout, select Invocation timed out from the drop-down list. The methods for viewing the other three types of logs are the same.
Table 4 Cause analysis Possible Cause
Description
Initialization failed
Log printed when the function initialization fails.
Load failed
Log generated when the runtime fails to load your function file.
System error
Internal error.
Invocation timed out
Log printed when the function invocation period is longer than the preset limit.
Memory threshold exceeded
Log printed when the function memory size exceeds the preset limit.
Disk threshold exceeded
Log printed when the disk size exceeds the preset limit.
Code error
Log printed when a code error occurs.

- You can view logs of the last hour, last day, last 3 days, or a custom time period.
- To manage function logs, go to the LTS console.
- Request List: Filter requests by request ID, result (success or failure), duration, actual memory or cause (initialization failed, load failed, system error, timed out, out of memory, out of disk space, or code error).
- Use log analysis.
On the Log Analysis tab page, you can configure log filtering fields for functions by referring to Configuring Log Filtering Fields for a Function. For details about how to analyze logs on LTS, see Searching and Analyzing Logs.
Configuring Log Filtering Fields for a Function
The log query function of FunctionGraph supports multiple filtering fields. First, perform the following steps:
- Return to the FunctionGraph console, and choose Functions > Function List in the navigation pane.
- Click the name of a function.
- Click Monitoring. On the Logs tab page, click the Log Analysis tab to analyze logs using LTS on the FunctionGraph console.
- Click Log Settings on the right. On the Index Settings page, click Auto Configure. Wait until the backend automatically configures all fields. Figure 6 Log settings

- After the automatic configuration is complete, change the type of the memory and duration fields to float. Then check whether the errorType field exists, if it does not exist, manually add it, as shown in Figure 7.
- Click OK. Return to the Monitoring > Logs > Request List tab page of the function to use related fields to filter information.
Downloading Logs
Constraints:
- A maximum of 5,000 logs can be downloaded at a time. When querying logs, select a proper time range to avoid log loss.
- The timestamp of logs is in UTC.
- Choose Monitoring > Logs > Request Logs.
- Select a time range, and click Download Log.
Feedback
Was this page helpful?
Provide feedbackThank you very much for your feedback. We will continue working to improve the documentation.See the reply and handling status in My Cloud VOC.
For any further questions, feel free to contact us through the chatbot.
Chatbot


