Compute
Elastic Cloud Server
Huawei Cloud Flexus
Bare Metal Server
Auto Scaling
Image Management Service
Dedicated Host
FunctionGraph
Cloud Phone Host
Huawei Cloud EulerOS
Networking
Virtual Private Cloud
Elastic IP
Elastic Load Balance
NAT Gateway
Direct Connect
Virtual Private Network
VPC Endpoint
Cloud Connect
Enterprise Router
Enterprise Switch
Global Accelerator
Management & Governance
Cloud Eye
Identity and Access Management
Cloud Trace Service
Resource Formation Service
Tag Management Service
Log Tank Service
Config
OneAccess
Resource Access Manager
Simple Message Notification
Application Performance Management
Application Operations Management
Organizations
Optimization Advisor
IAM Identity Center
Cloud Operations Center
Resource Governance Center
Migration
Server Migration Service
Object Storage Migration Service
Cloud Data Migration
Migration Center
Cloud Ecosystem
KooGallery
Partner Center
User Support
My Account
Billing Center
Cost Center
Resource Center
Enterprise Management
Service Tickets
HUAWEI CLOUD (International) FAQs
ICP Filing
Support Plans
My Credentials
Customer Operation Capabilities
Partner Support Plans
Professional Services
Analytics
MapReduce Service
Data Lake Insight
CloudTable Service
Cloud Search Service
Data Lake Visualization
Data Ingestion Service
GaussDB(DWS)
DataArts Studio
Data Lake Factory
DataArts Lake Formation
IoT
IoT Device Access
Others
Product Pricing Details
System Permissions
Console Quick Start
Common FAQs
Instructions for Associating with a HUAWEI CLOUD Partner
Message Center
Security & Compliance
Security Technologies and Applications
Web Application Firewall
Host Security Service
Cloud Firewall
SecMaster
Anti-DDoS Service
Data Encryption Workshop
Database Security Service
Cloud Bastion Host
Data Security Center
Cloud Certificate Manager
Edge Security
Situation Awareness
Managed Threat Detection
Blockchain
Blockchain Service
Web3 Node Engine Service
Media Services
Media Processing Center
Video On Demand
Live
SparkRTC
MetaStudio
Storage
Object Storage Service
Elastic Volume Service
Cloud Backup and Recovery
Storage Disaster Recovery Service
Scalable File Service Turbo
Scalable File Service
Volume Backup Service
Cloud Server Backup Service
Data Express Service
Dedicated Distributed Storage Service
Containers
Cloud Container Engine
Software Repository for Container
Application Service Mesh
Ubiquitous Cloud Native Service
Cloud Container Instance
Databases
Relational Database Service
Document Database Service
Data Admin Service
Data Replication Service
GeminiDB
GaussDB
Distributed Database Middleware
Database and Application Migration UGO
TaurusDB
Middleware
Distributed Cache Service
API Gateway
Distributed Message Service for Kafka
Distributed Message Service for RabbitMQ
Distributed Message Service for RocketMQ
Cloud Service Engine
Multi-Site High Availability Service
EventGrid
Dedicated Cloud
Dedicated Computing Cluster
Business Applications
Workspace
ROMA Connect
Message & SMS
Domain Name Service
Edge Data Center Management
Meeting
AI
Face Recognition Service
Graph Engine Service
Content Moderation
Image Recognition
Optical Character Recognition
ModelArts
ImageSearch
Conversational Bot Service
Speech Interaction Service
Huawei HiLens
Video Intelligent Analysis Service
Developer Tools
SDK Developer Guide
API Request Signing Guide
Terraform
Koo Command Line Interface
Content Delivery & Edge Computing
Content Delivery Network
Intelligent EdgeFabric
CloudPond
Intelligent EdgeCloud
Solutions
SAP Cloud
High Performance Computing
Developer Services
ServiceStage
CodeArts
CodeArts PerfTest
CodeArts Req
CodeArts Pipeline
CodeArts Build
CodeArts Deploy
CodeArts Artifact
CodeArts TestPlan
CodeArts Check
CodeArts Repo
Cloud Application Engine
MacroVerse aPaaS
KooMessage
KooPhone
KooDrive
On this page

Use of FunctionGraph

Updated on 2024-11-12 GMT+08:00

FunctionGraph allows you to run your code without provisioning or managing servers, while ensuring high availability and scalability. All you need to do is upload your code and set execution conditions, and FunctionGraph will take care of the rest. You pay only for what you use and you are not charged when your code is not running.

To quickly create a function using FunctionGraph, do as follows:
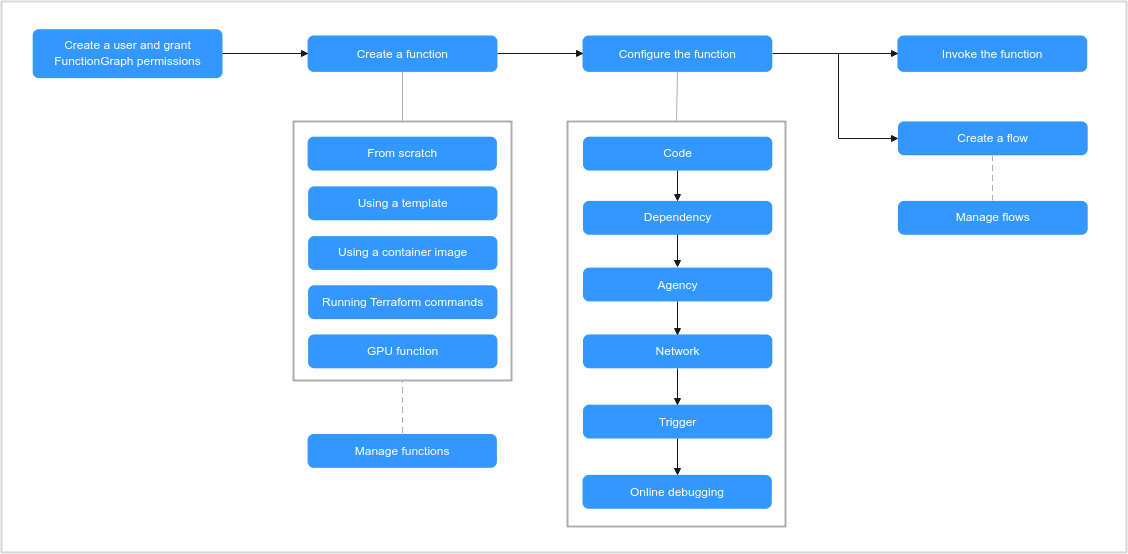
  1. Set permissions: Ensure that you have the FunctionGraph Administrator permissions.
  2. Create a function: Create a function from scratch or using the sample code or a container image.
  3. Configure the function: Configure the code source or modify other parameters.
  4. Test the function: Create a test event to debug the function.
  5. View the execution result: On the function details page, view the execution result based on the configured test event.
  6. View metrics: On the Monitoring tab page of the function details page, view function metrics.

Process

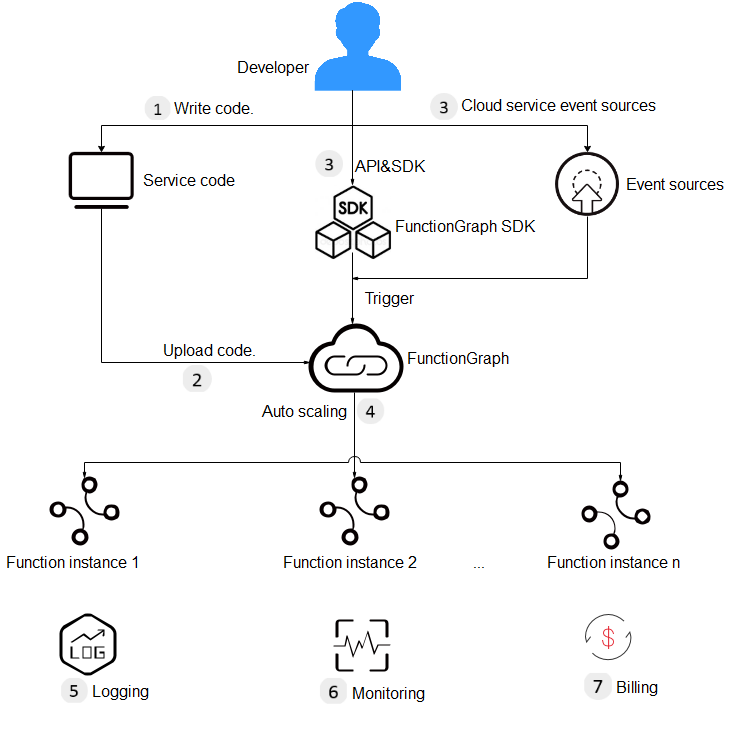
Figure 1 shows the process of using functions.

  1. Write code, package and upload it to FunctionGraph, and add event sources such as Simple Message Notification (SMN) and API Gateway (APIG) event sources to build applications.
  2. Functions are triggered by RESTful API calls or event sources to achieve expected service purposes. During this process, FunctionGraph automatically schedules resources.
  3. View logs and metrics. Note that you will be billed based on code execution duration.
    Figure 1 Flowchart

The following shows the details:

  1. Write code.

    Write code in Node.js, Python, Java, C#, PHP, or Go. For details, see the FunctionGraph Developer Guide.

  2. Upload code.

    Edit code inline, upload a local ZIP or JAR file, or upload a ZIP file from OBS. For details, see Creating a Deployment Package.

  3. Trigger functions by API calls or cloud service events.

    Functions are triggered by API calls or cloud service events. For details, see Creating Triggers.

  4. Implement auto scaling.

    FunctionGraph implements auto scaling based on the number of requests. For details, see Notes and Constraints.

  5. View logs.

    View run logs of function. FunctionGraph is interconnected with Log Tank Service (LTS). For details, see Logs.

  6. View monitoring information.

    View graphical monitoring information. FunctionGraph is interconnected with Cloud Eye. For details, see Metrics.

  7. Check your bills.

    After function execution is complete, you will be billed based on the number of function execution requests and execution duration. For details, see .Bills.

Introduction to Dashboard

Log in to the FunctionGraph console and choose Dashboard in the navigation pane on the left.
  • View your created functions/function quota, used storage/storage quota, and monthly invocations and resource usage.
    Figure 2 Monthly statistics
  • View tenant-level metrics, including invocations, top 10 functions by invocation, errors, top 10 functions by error, duration, and throttles.

    Table 1 describes the function metrics.

    Table 1 Function metrics

    Metric

    Unit

    Description

    Invocations

    Count

    Total number of invocation requests, including invocation errors and throttled invocations. In case of asynchronous invocation, the count starts only when a function is executed in response to a request.

    The 10 Functions with the Most Invocations

    -

    Top 10 functions by invocation in the last day, last 3 days, or a custom period.

    Duration

    ms

    Maximum duration: the maximum duration all functions are executed at a time within a period.

    Minimum duration: the minimum duration all functions are executed at a time within a period.

    Average duration: the average duration all functions are executed at a time within a period.

    Errors

    Count

    Number of times that your functions failed with error code 200 being returned. Errors caused by function syntax or execution are also included.

    The 10 Functions with the Most Errors

    -

    Top 10 functions by error in the last day, last 3 days, or a custom period.

    Throttles

    Count

    Number of times that FunctionGraph throttles your functions due to the resource limit.

  • View flow metrics, including the number of invocations, duration, number of errors, and number of running workflows.

    Metric

    Unit

    Description

    Invocations

    Count

    Total number of invocation requests, including successful, failed, and ongoing requests. In case of asynchronous invocation, the count starts only when a flow executes in response to a request.

    Duration

    ms

    Average time taken to execute a flow in a specified period.

    Errors

    Count

    Number of times that flows failed to be executed.

    Running Workflows

    Count

    Number of ongoing flow executions.

We use cookies to improve our site and your experience. By continuing to browse our site you accept our cookie policy. Find out more

Feedback

Feedback

Feedback

0/500

Selected Content

Submit selected content with the feedback