
Suggestions on RDS for PostgreSQL Metric Alarm Configurations
You can set alarm rules on Cloud Eye to customize the monitored objects and notification policies and keep track of the instance status. This topic describes how to configure RDS for PostgreSQL metric alarm rules.
Creating a Metric Alarm Rule
- Log in to the management console.
- Click
 in the upper left corner and select a region and a project.
 - Click Service List. Under Management & Governance, click Cloud Eye.
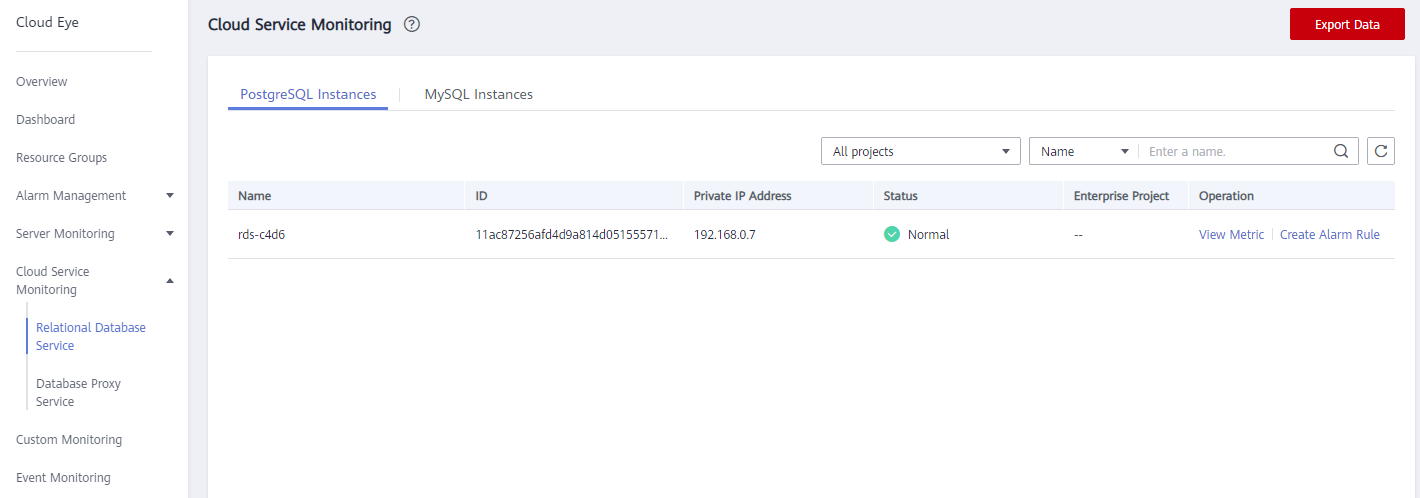
- In the navigation pane on the left, choose Cloud Service Monitoring > Relational Database Service.
Figure 1 Choosing a monitored object
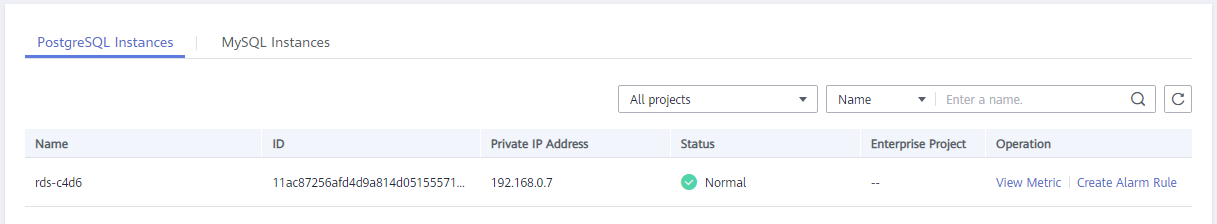
- Locate the DB instance for which you want to create an alarm rule and click Create Alarm Rule in the Operation column.
Figure 2 Creating an alarm rule
- On the displayed page, set parameters as required.
Table 1 Alarm rule information Parameter
Description
Name
Alarm rule name. The system generates a random name, which you can modify.
Description
Description about the rule.
Method
There are three options: Associate template, Use existing template, and Configure manually.
NOTE:If you select Associate template, after the associated template is modified, the policies contained in this alarm rule to be created will be modified accordingly.
You are advised to select Use existing template. The existing templates already contain three common alarm metrics: CPU usage, memory usage, and storage space usage.
Template
Select the template to be used.
You can select a default alarm template or create a custom template.
Alarm Policy
Policy for triggering an alarm.
Whether to trigger an alarm depends on whether the metric data in consecutive periods reaches the threshold. For example, Cloud Eye triggers an alarm if the average CPU usage of the monitored object is 80% or more for three consecutive 5-minute periods.
NOTE:A maximum of 50 alarm policies can be added to an alarm rule. If any one of these alarm policies is met, an alarm is triggered.
Alarm Severity
The alarm severity can be Critical, Major, Minor, or Informational.
Figure 3 Configuring alarm notification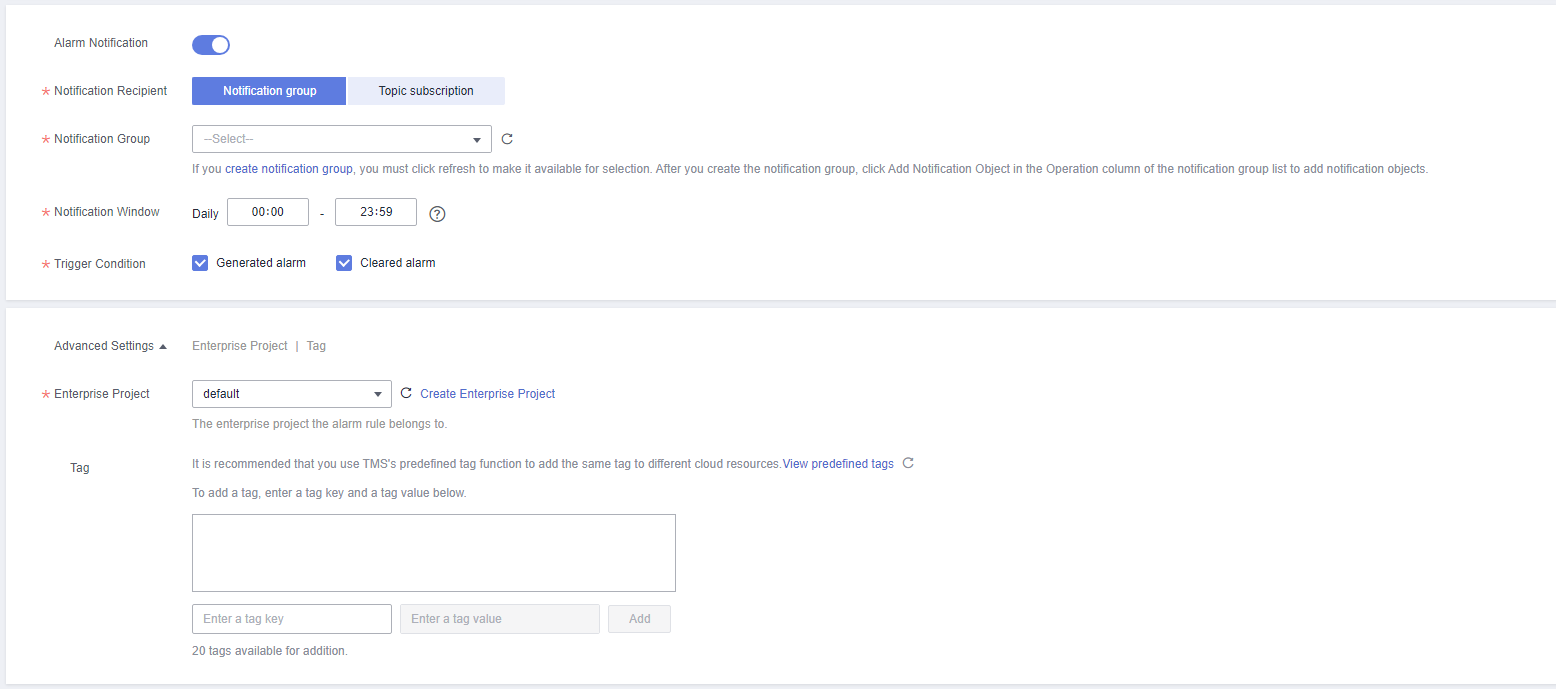
Table 2 Alarm notification Parameter
Description
Alarm Notification
Whether to notify users when alarms are triggered. Notifications can be sent by email, text message, or HTTP/HTTPS message.
Notification Recipient
You can select a notification group or topic subscription as required.
Notification Group
Notification group the alarm notification is to be sent to.
Notification Object
Object the alarm notification is to be sent to. You can select the account contact or a topic.
- The account contact is the mobile phone number and email address of the registered account.
- A topic is used to publish messages and subscribe to notifications.
Notification Window
Cloud Eye sends notifications only within the notification window specified in the alarm rule.
If Notification Window is set to 08:00-20:00, Cloud Eye sends notifications only within 08:00-20:00.
Trigger Condition
Condition for triggering an alarm notification. You can select Generated alarm (when an alarm is generated), Cleared alarm (when an alarm is cleared), or both.
Enterprise Project
Enterprise project that the alarm rule belongs to. Only users with the enterprise project permissions can view and manage the alarm rule.
Tag
A tag is a key-value pair. Tags identify cloud resources so that you can easily categorize and search for your resources.
- Click Create. The alarm rule is created.
For details about how to create alarm rules, see Creating an Alarm Rule in the Cloud Eye User Guide.
Metric Alarm Configuration Suggestions
|
Metric ID |
Name |
Metric Description |
Threshold in Best Practices |
Alarm Severity in Best Practices |
Handling Suggestion |
|---|---|---|---|---|---|
|
rds001_cpu_util |
CPU Usage |
CPU usage of the monitored object |
Raw data > 80% for three consecutive periods |
Major |
|
|
rds002_mem_util |
Memory Usage |
Memory usage of the monitored object |
Raw data > 90% for three consecutive periods |
Major |
|
|
rds039_disk_util |
Storage Space Usage |
Storage space usage of the monitored object |
Raw data > 80% for three consecutive periods |
Major |
|
|
rds045_oldest_replication_slot_lag |
Oldest Replication Slot Lag |
Lagging size of the most lagging replica in terms of WAL data received |
Raw data > 20,480 MB for one period |
Major |
Rectify the fault by referring to Troubleshooting High Oldest Replication Slot Lag or Replication Lag. |
|
rds046_replication_lag |
Replication Lag |
Replication lag |
Raw data > 600s for three consecutive periods |
Major |
|
|
rds083_conn_usage |
Connection Usage |
Percent of used PostgreSQL connections to the total number of connections |
Raw data > 80% for three consecutive periods |
Major |
|
|
active_connections |
Active Connections |
Number of active database connections |
Raw data > [vCPUs x 2] for one period |
Major |
Rectify the fault by referring to Troubleshooting Abnormal Connections and Active Connections |
|
oldest_transaction_duration |
Oldest Active Transaction Duration |
Length of time since the start of the transaction that has been active longer than any other current transaction |
Set the threshold as required. Reference value: Raw data > 7,200,000 ms for one period |
Major |
Rectify the fault by referring to Troubleshooting Long-Running Transactions. |
|
oldest_transaction_duration_2pc |
Oldest Two-Phase Commit Transaction Duration |
Length of time since the start of the transaction that has been prepared for two-phase commit longer than any other current transaction |
Set the threshold as required. Reference value: Raw data > 7,200,000 ms for one period |
Major |
|
|
db_max_age |
Maximum Database Age |
Maximum age of the current database, which is the value of max(age(datfrozenxid)) in the pg_database table |
Raw data > 1,000,000,000 for one period |
Major |
Rectify the fault by referring to Troubleshooting Database Age Increase Problem. |
|
slow_sql_three_second |
Number of SQL Statements Executed for More Than 3s |
Number of slow SQL statements whose execution time is longer than 3s This metric shows an instantaneous value at the collection time instead of an accumulated value within 1 minute. |
Set the threshold as required. Reference value: Raw data > [vCPUs x 2] for one period |
Major |
Rectify the fault by referring to Troubleshooting SQL Statements That Have Been Executed for 3s or 5s. |
|
slow_sql_five_second |
Number of SQL Statements Executed for More Than 5s |
Number of slow SQL statements whose execution time is longer than 5s This metric shows an instantaneous value at the collection time instead of an accumulated value within 1 minute. |
Set the threshold as required. Reference value: Raw data > [vCPUs x 2] for one period |
Major |
|
|
inactive_logical_replication_slot |
Inactive Logical Replication Slots |
Number of inactive logical replication slots |
Raw data > 1 for three consecutive periods |
Major |
Rectify the fault by referring to Troubleshooting Inactive Logical Replication Slots. |
Feedback
Was this page helpful?
Provide feedbackThank you very much for your feedback. We will continue working to improve the documentation.See the reply and handling status in My Cloud VOC.
For any further questions, feel free to contact us through the chatbot.
Chatbot


