
Comprehensive Monitoring of NPU Metrics
Application Scenarios
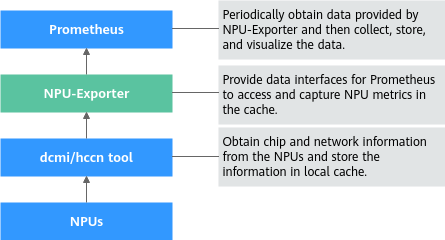
If a cluster contains some NPU nodes, monitoring NPU metrics helps you identify performance bottlenecks, optimize resource utilization, and quickly locate exceptions to improve system stability and efficiency. In CCE standard and Turbo clusters, NPU-Exporter allows real-time monitoring and alarm reporting by uploading NPU metric data collected via DCMI or hccn tool to the cloud native monitoring system. This helps improve system reliability and performance. NPU-Exporter can collect 73 NPU metrics, covering aspects like health, power consumption, and temperature, enabling a detailed view of NPU statuses. For more information, see NPU Metrics.
This section describes how to enable NPU-Exporter and monitor NPU metrics in real time.
Prerequisites
- There is an AI-accelerated node (AI-accelerated ECSs) in the cluster, and the NPU driver of 24.x or later has been installed.

To upgrade a driver, ensure that the NPU firmware is available on the node. Reinstalling the driver will restart the node. You are advised to drain the node before installing the driver. For details, see Draining a Node. VMs do not support firmware upgrade.
If a driver upgrade fails, see "What Can I Do If an NPU Driver Fails to Be Upgraded?" in FAQs > "Chart and Add-on".
- The CCE AI Suite (Ascend NPU) add-on has been installed in the cluster and its version is 2.1.55 or later. For details, see CCE AI Suite (Ascend NPU).
- The Cloud Native Cluster Monitoring add-on has been installed in the cluster and its version is 3.12.1 or later. For details, see Cloud Native Cluster Monitoring. To upload NPU metrics to AOM, enable Report Monitoring Data to AOM for the Cloud Native Cluster Monitoring add-on.
- If you need to create an NPU metric dashboard in Grafana, you will need to install the Grafana add-on in the cluster and enable Public Access for Grafana. For details, see Grafana.
Process
| Procedure | Description | Billing |
|---|---|---|
| After NPU-Exporter is enabled, the system can monitor and collect NPU metric data and expose the data in Prometheus-compatible format. | N/A | |
| By default, Cloud Native Cluster Monitoring does not automatically collect or report metrics exposed by NPU-Exporter. You need to go to Settings to manually enable data collection. | N/A | |
| (Optional) To view NPU metrics on AOM, take this step. | The collected NPU metrics in this section are custom metrics. Uploading such metrics to AOM incurs fees. For details, see Pricing Details. | |
| (Optional) To monitor NPU performance data in real time using a Grafana dashboard, take this step. |
| |
| (Optional) To disable NPU-Exporter after use, take this step. | N/A |
Step 1: Enable NPU-Exporter
NPU-Exporter monitors and collects NPU metric data and exposes the data in Prometheus-compatible format, so that you can use monitoring systems such as Prometheus to monitor NPUs and generate alarms. If the CCE AI Suite (Ascend NPU) add-on version is 2.1.55 or later, NPU-Exporter is supported. To enable NPU-Exporter, take the following steps:
- Log in to the CCE console and click the cluster name to access the cluster console. In the navigation pane, choose Overview. In the navigation pane, choose Add-ons, locate the CCE AI Suite (Ascend NPU) add-on, and click Edit.
- In the Metric-based Observation area, enable Use NPU-Exporter to Observe NPU Metrics and click OK in the lower right corner of the page. NPU-Exporter is then deployed on the NPU nodes as a DaemonSet to observe NPU metrics. Figure 2 Enabling NPU-Exporter

- After the add-on status changes to Running, click View Details. In the window that slides out from the right, click the Pods tab. If there is an npu-exporter-xxx pod in the pod list and it is in the Running state, NPU-Exporter has been enabled.
Step 2: Collect NPU Metrics
By default, the metrics exposed by NPU-Exporter are not collected and reported by Cloud Native Cluster Monitoring. After installing the Cloud Native Cluster Monitoring add-on, you need to go to the Settings and manually enable data collection. The following cases are involved:
- The target preset policy is disabled: If the Cloud Native Cluster Monitoring add-on has been installed but its preset policy is not enabled in Settings, enable NPU-Exporter data collection on the ServiceMonitor Policies tab in Settings.
- The target preset policy is enabled: If Cloud Native Cluster Monitoring has been installed and its preset policy has been enabled in Settings, enable NPU-Exporter data collection on the Preset Policies tab.
If the Cloud Native Cluster Monitoring add-on has been installed but its preset policy is not enabled in Settings, take the following steps to enable data collection:
- Log in to the CCE console and click the cluster name to access the cluster console.
- In the navigation pane, choose Cluster > Settings. Then, click the Monitoring tab. In the Collection Settings area, find ServiceMonitor Policies and click Manage.
- On the Collection Settings page, click the search box, select Name, choose npu-exporter from the drop-down list, and enable it. Figure 3 Enabling a ServiceMonitor policy

If you have enabled Preset Policies in the Settings, the preset ServiceMonitor and PodMonitor policies will be deleted. As a result, the NPU metric data exposed by NPU-Exporter cannot be reported through ServiceMonitor policies. To collect the NPU-Exporter data, take the following steps:
- Log in to the CCE console and click the cluster name to access the cluster console.
- In the navigation pane, choose Cluster > Settings. Then, click the Monitoring tab. In the Collection Settings area, find Preset Policies and click Manage.
- On the Collection Settings page, click the search box, select Name, and choose npu-exporter from the drop-down list. In the search result, choose All metrics in the Collection Metric column and enable NPU-Exporter. Figure 4 Enabling a preset policy

Step 3: View NPU Metrics on AOM
To view NPU metrics on AOM, ensure that the function of reporting monitoring data to AOM has been enabled in Cloud Native Cluster Monitoring. The collected NPU metrics in this section are custom metrics. Uploading such metrics to AOM incurs fees. For details, see Pricing Details.
- Go to the AOM console. In the navigation pane, choose Instances. In the right pane, click the name of the AOM instance to which metrics are reported. Figure 5 Selecting an AOM instance

- On the page displayed, choose Metric Management. In the right pane, click the Metrics tab, choose the target cluster name from the Cluster drop-down list, and enter NPU in the search box to view NPU metrics.
Step 4: Use Grafana to View NPU Metrics
Grafana dashboards display real-time NPU performance data. You can configure Grafana dashboards to quickly detect exceptions and locate faults, improving O&M efficiency. Grafana can be interconnected with AOM or Prometheus data sources.
- To use an AOM data source, enable Report Monitoring Data to AOM in Cloud Native Cluster Monitoring and Interconnect with AOM in Grafana. In addition, make sure to use the same AOM instances for both add-ons. Then, Grafana will automatically generate the prometheus-aom data source.
- To use a Prometheus data source, enable Local Data Storage in Cloud Native Cluster Monitoring. Then, you can directly use the prometheus data source provided by Grafana.
- Test connectivity of the data source. Ensure the prometheus-aom or prometheus data source is accessible to Grafana. Otherwise, it will not be available in Grafana.
- In the navigation pane, choose Cluster > Add-ons. In the right pane, find the Grafana add-on and click Access to go to its GUI.
- Enter the username and password when you access the Grafana GUI for the first time. The default username and password are both admin. After entering the username and password, reset the password following instructions.
- In the upper left corner of the page, click
 . Then, click
  on the left of Connections. Click Data sources to access the Data sources page.
 - In the data source list, click prometheus-aom or prometheus. Click Save & test at the bottom of the data source page to verify connectivity. If "Successfully queried the Prometheus API" is displayed, the connectivity test has been passed. Figure 6 Connectivity test passed

- Go to Grafana dashboards, search for ascend-npu-exporter in the search box, and click the name of the found dashboard. On the ascend-npu-exporter dashboard page, click Download JSON on the right to download the JSON file of the dashboard. The official Ascend NPU-Exporter dashboard is provided. You can view NPU metrics using this dashboard.
Go back to the Grafana GUI, click
 in the upper left corner of the page to open the menu bar and click Dashboards. In the upper right corner of the Dashboards page, click New and choose Import from the drop-down list. On the Import dashboard page, upload the downloaded JSON file, choose the prometheus-aom or prometheus data source from Prometheus, and click Import.
For more details about how to import a dashboard to Grafana, see Manage dashboards.
Figure 7 Importing a dashboard
- View the imported dashboard. Click
 in the upper right corner to save the dashboard.
Step 5: Disable NPU-Exporter
To disable NPU-Exporter after use, take the following steps:
- Log in to the CCE console and click the cluster name to access the cluster console. In the navigation pane, choose Overview. In the navigation pane, choose Add-ons, locate the CCE AI Suite (Ascend NPU) add-on, and click Edit.
- In the Metric-based Observation area, enable Use NPU-Exporter to Observe NPU Metrics and click OK in the lower right corner of the page.
- After the add-on status changes to Running, click View Details. In the window that slides out from the right, click the Pods tab. If the npu-exporter-xxx pod disappears in the pod list, NPU-Exporter has been disabled.
Feedback
Was this page helpful?
Provide feedbackThank you very much for your feedback. We will continue working to improve the documentation.See the reply and handling status in My Cloud VOC.
For any further questions, feel free to contact us through the chatbot.
Chatbot


