Graph Editor
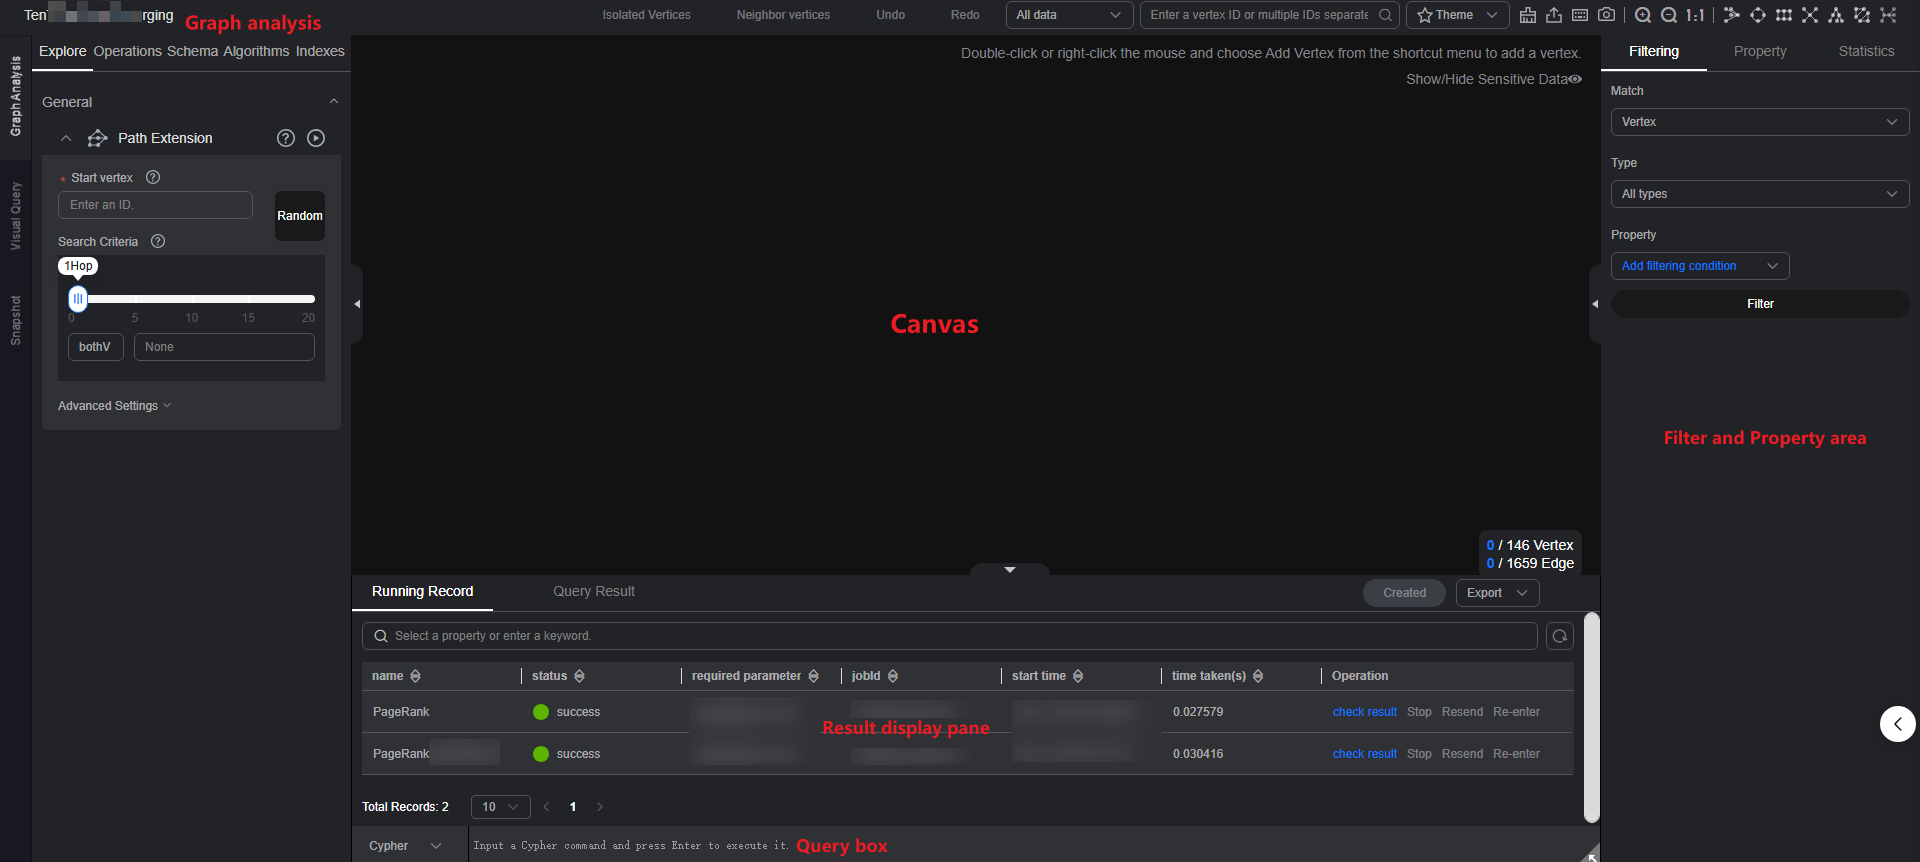
The graph editor consists of several sections: analysis section (including exploration, operation, schema, algorithm, and index sections), canvas, query text box, result display pane, and filtering and property tabs.
|
Area |
Description |
|---|---|
|
Exploration pane |
Provides graph-related tools for exploring graphs (for example, path expansion). For detailed function descriptions, refer to Analyzing a Graph Using Graph Exploration. |
|
Operations |
Operations executed by API calls. For detailed function descriptions, refer to Adding a Custom Operation Set to a Graph. |
|
Schema |
Metadata operations, such as adding, hiding, importing, and exporting data. For detailed function descriptions, refer to Configuring the Schema Data of a Graph. |
|
Algorithms |
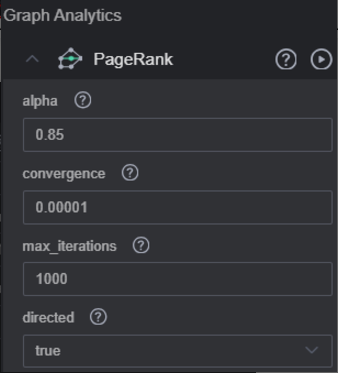
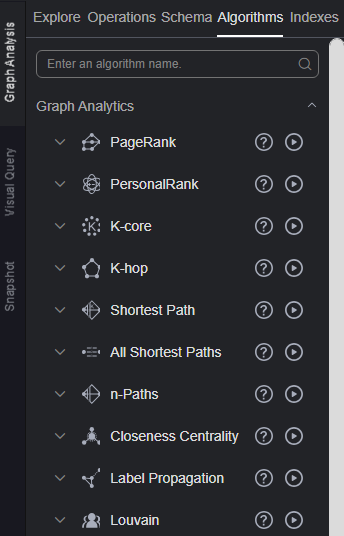
Algorithms supported by GES. You can set the properties of each algorithm in this area. Table 2 describes the functions of the algorithm library.
NOTE:
After you select an algorithm in the algorithm library and execute it, the canvas displays the sampling sub-graph that contains the key result. The execution result is incomplete. To obtain the complete returned result, call the corresponding API. |
|
Index area |
The index management function is added to the graph access page to facilitate index addition, deletion, and search. |
|
Canvas |
Graph structure of data. Shortcut operations are preset in the drawing area for you to easily analyze the graph data. Table 3 describes the functions of the drawing area. |
|
Query box |
|
|
Result display pane |
There are two tab pages:
|
|
Filter and Property area |
On the canvas, select a vertex and right-click it. Then, choose View Property from the shortcut menu to view the Filter and Property area. It contains the following three tabs:
|

Pay attention to the following restrictions on graphs of the database edition:
- There is no Algorithms tab on the page.
- Labels cannot be added on the Schema tab.
- There is no Operations tab (custom operations cannot be added).
- Only cypher queries are supported. Gremlin is not supported.
|
GUI Element |
Description |
|---|---|
|
|
Enter the algorithm name to quickly find it. |
|
|
Expand the algorithm parameter configuration area. |
|
|
Run the algorithm. |
|
|
Set the properties of an algorithm. The properties of each algorithm differ. For details, see Graph Algorithms. |
|
GUI Element |
Description |
|---|---|
|
|
Row 1: 13 indicates the number of vertices displayed on the current canvas and 886813 indicates the total number of vertices in the entire graph. Row 2: 9 indicates the number of edges displayed on the current canvas and 892773 indicates the total number of edges in the entire graph. |
|
|
An isolated vertex is a vertex that is not an endpoint of any edge.
|
|
|
Select a non-isolated vertex in the canvas and click neighbor vertices to view all vertices associated. |
|
|
Cancel the previous operation. |
|
|
Redo the canceled previous operation. |
|
|
Select All data or Current data.
|
|
|
You can change the theme of the graph editor. Three themes are supported: light, dark, and system. |
|
|
After you select All data or Current data, enter the node ID in the search box. Press Enter or click the query icon to search for the corresponding vertex and render it to the canvas.
NOTE:
|
|
|
Click the clear canvas icon to clear all content on the canvas. |
|
|
Export the canvas content as a TXT file (vertex and edge file of the current canvas). |
|
|
Keyboard shortcuts
|
|
|
You can create a snapshot for the graph shown on the canvas and then restore it from the snapshot. For more information on this feature, refer to the snapshot section. |
|
|
Zoom in the graph. You can zoom in a graph to at most 600%. |
|
|
Zoom out the graph. You can zoom out a graph to 5%. |
|
|
Automatic screen adaptation When the displayed graph data is too large (cannot be completely displayed) or too small, you can click this button to quickly adjust it based on the screen size. |
|
|
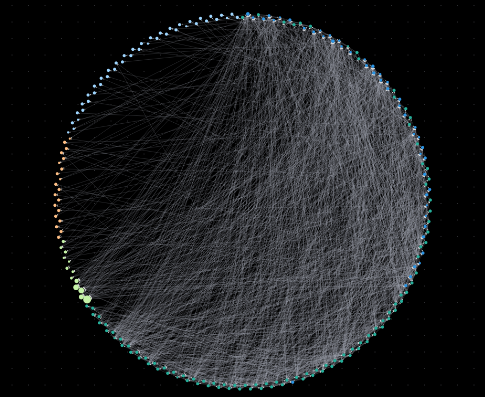
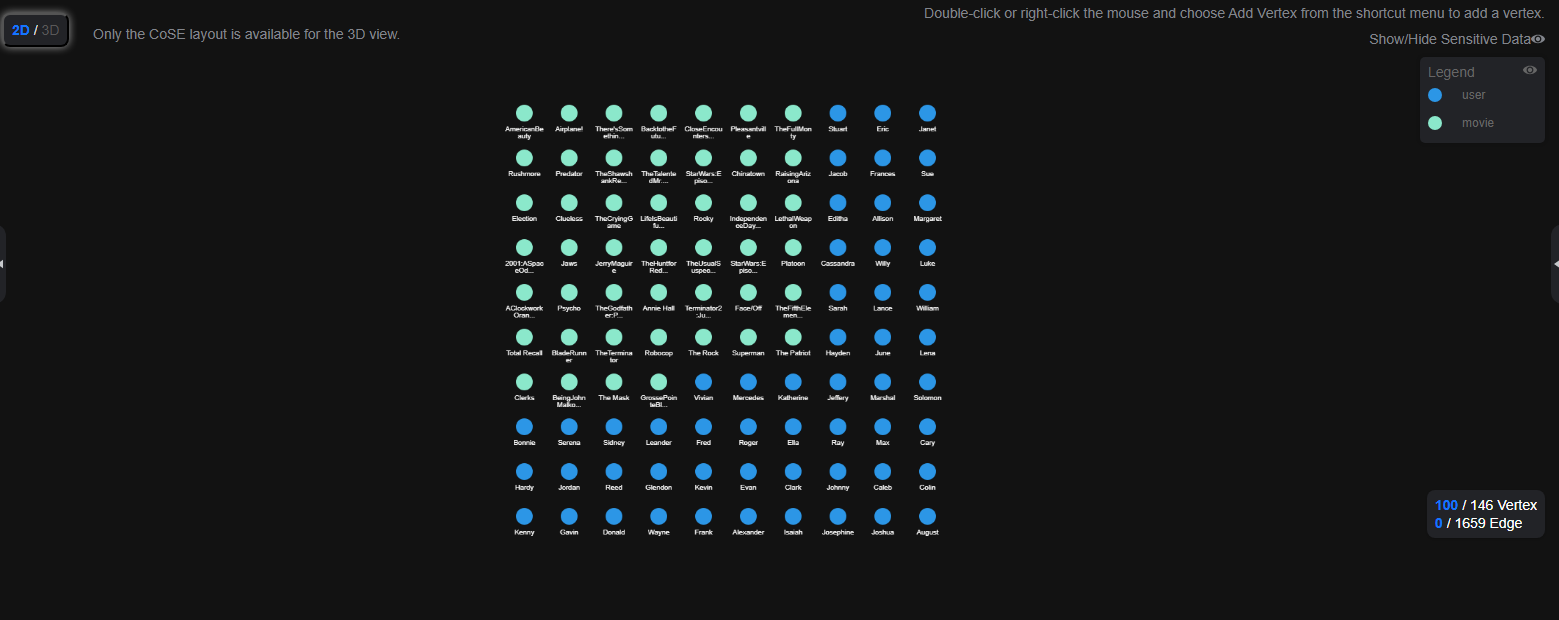
Quick layout switchover. From left to right: Circle, Grid, Radial-tree, Hierarchical, CoSE, and Double-core. Figure Circle shows how the graph looks on the canvas.
NOTE:
The Double-core takes effect only when two nodes are selected. |
|
|
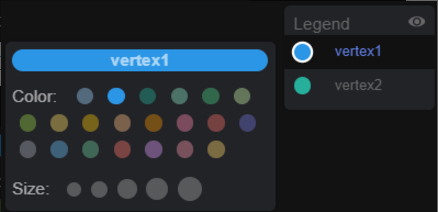
Click a vertex to select the color and size, which is a good way to mark data. |
|
|
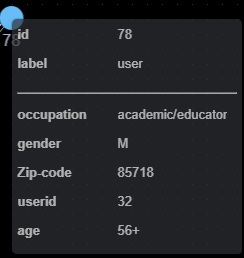
Vertex details. Move the cursor to a non-virtualized vertex. The ID, label, and properties of this vertex are displayed.
NOTE:
A maximum of six properties of a vertex can be displayed in the pop-up window. When the number of properties is greater than six, you can view all of them in the filter and property tab as shown in Editor page. |
|
Shortcut operations in the drawing area |
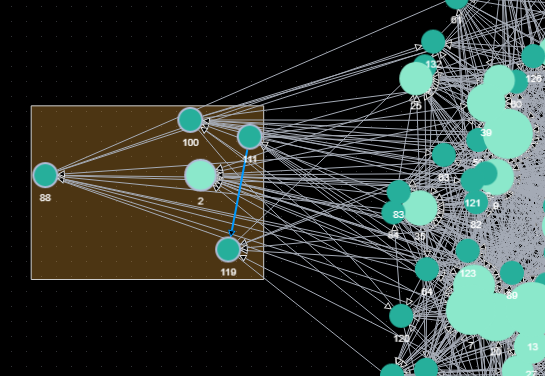
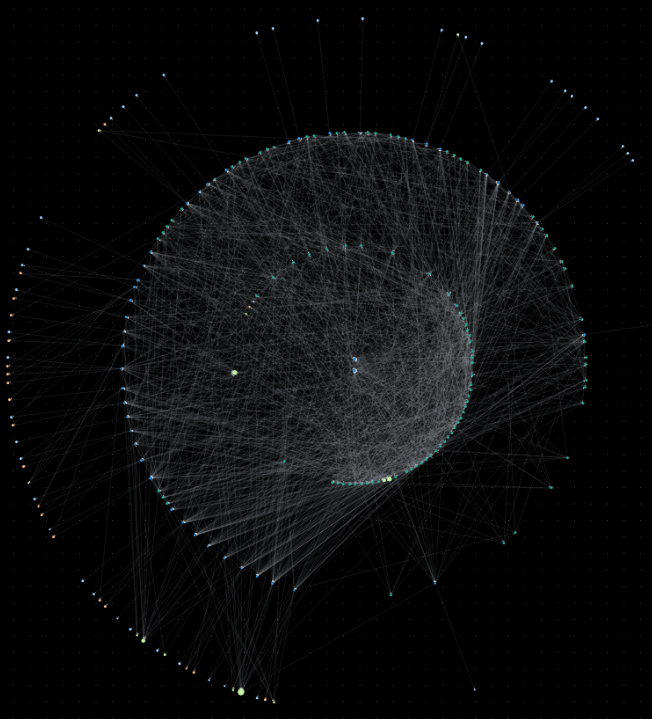
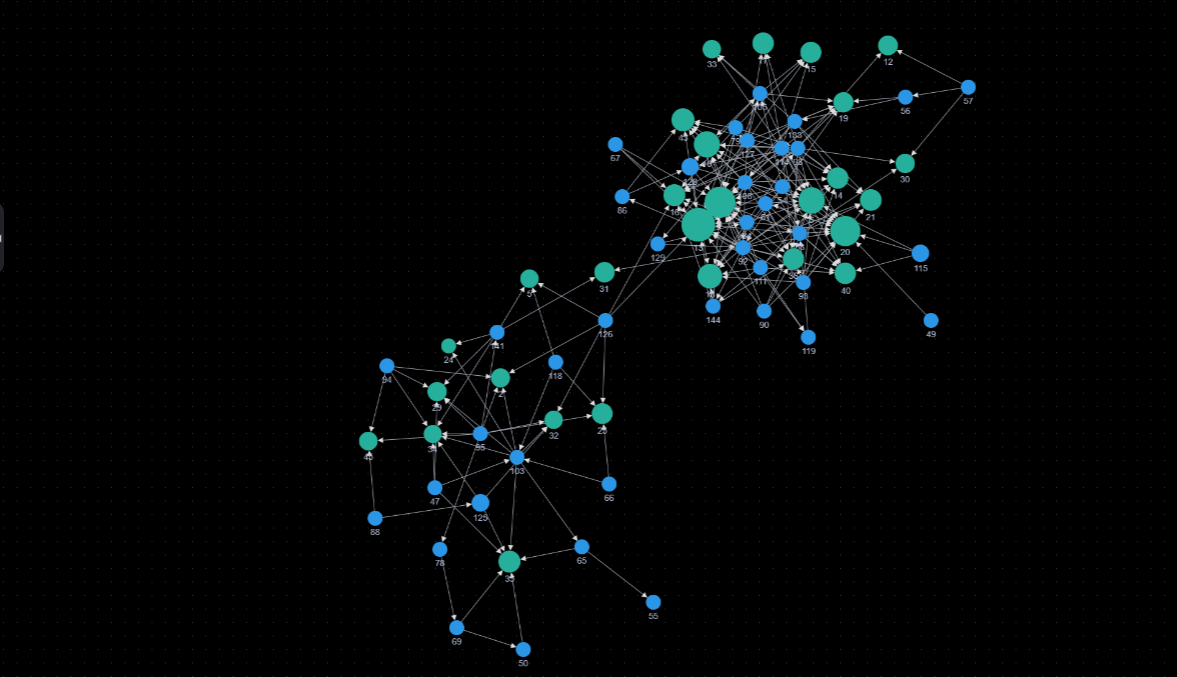
Box-select: Shift + Left-click and drag All vertices in the box are selected, as illustrated in the following figure.
|
|
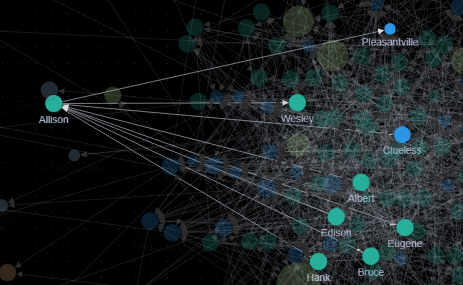
Multi-select: Ctrl + Left-click and drag All vertices in the box are selected and highlighted, as illustrated in the following figure.
|
|
|
Select/Deselect: Ctrl + Left-click Press Ctrl and left-click a vertex or an edge to select and highlight it. Press Ctrl and left-click the vertex or edge again to deselect it. |
|
|
Select all: Ctrl + A Select and highlight all vertices and edges. |
|
|
Select associated vertices and edges: Ctrl + E Select a vertex and press Ctrl + E to highlight all vertices and edges associated with it. |
|
|
Hide: Delete Select a vertex or edge and press Delete to hide the vertex or edge. |
|
|
Adaptation: Ctrl + F Automatically zoom in or out all vertices and edges based on the current screen width and height. |
|
|
Zoom out: - Press the - key on the keyboard to zoom out the graph. |
|
|
Zoom in: = (+) Press the + key on the keyboard to zoom in the graph. |
|
|
Deselect: Esc Deselect all selected and highlighted vertices and edges. |
|
|
Zoom in and zoom out: Scroll the mouse wheel forwards and backwards. Scroll the mouse wheel to zoom in or out the graph. |



Feedback
Was this page helpful?
Provide feedbackThank you very much for your feedback. We will continue working to improve the documentation.See the reply and handling status in My Cloud VOC.
For any further questions, feel free to contact us through the chatbot.
Chatbot

