
Configuring the Schema Data of a Graph
In the metadata analysis area of the graph editor, you can perform the following operations:
- Adding a Label
- Counting Vertices and Edges
- Modifying a Label
- Hiding a Label
- Importing and Exporting Labels
- Deleting a Label
Adding a Label
 to add a label.
 - Set Label Name to the name of the label to be added.
- Type: You can select a label type (vertex, edge, or general-purpose). General-purpose indicates that a label can represent either a vertex or an edge.
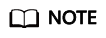
- Custom vertex style: You can define the color and mark of a label to distinguish vertices.
- Add properties. By default, only the first added property is displayed on the canvas. You can manually adjust the property to be displayed. The canvas will respond in real time. Figure 1 Adding a label

Counting Vertices and Edges
On the Schema tab of the graph editor, click Refresh Vertex and Edge Count. The system counts the total number of vertices and edges in the current graph. You can also view the last count time.

Modifying a Label
This function is only available on graph version 2.3.18 or later.
In the metadata file list, click the metadata file for which you want to modify the label. The metadata label details page is displayed.
- You can modify the label's property name, cardinality, and data type.
- To hide or delete a property, click the hide or remove button in the Operation column.
- If you accidentally deleted or incorrectly modified a property, click the reset button to restore to the last saved data.
Confirm the modification and click Save.


Importing and Exporting Labels
You can import the metadata, edge data, and vertex data of a graph to or export them from an OBS bucket.
- Import: Click Import in the metadata list. In the dialog box that is displayed, set Metadata, Edge Data, Vertex Data, Log Storage Path, Edge Processing, and Import Type, and click OK to import the data from the OBS bucket to a graph.
- Log Storage Path: Stores vertex and edge data sets that do not comply with the metadata definition, as well as detailed logs generated during graph import.
- Edge Processing: Includes Allow repetitive edges, Ignore subsequent repetitive edges, Overwrite previous repetitive edges, and Ignore labels on repetitive edges. Repetitive edges have the same source vertex and target vertex. When labels are considered, repetitive edges must have the same source and target vertices and the same labels.
Figure 6 Importing metadata
- Export: Click Export in the metadata list. In the dialog box that is displayed, set Metadata Name, Vertex Data Set, Edge Data Set, and Export Path, and click OK to export the data to the OBS bucket. Figure 7 Exporting metadata

Deleting a Label
- After this API is called, all data associated with the label will be deleted. Exercise caution when performing this operation.
- If the graph version is earlier than 2.2.18, schema labels cannot be deleted.
- Schema labels cannot be deleted from graphs of the database edition.
- The default label _DEFAULT_ cannot be deleted.

To delete a label, do the following:
- To delete a label, click the deletion icon next to the schema on the Schema tab on the left of the graph engine editor. Figure 8 Deleting a label

- In the dialog box that appears, read the prompt information carefully, confirm the label name to be deleted, enter DELETE in the box (or click Auto Enter), and then click OK. Figure 9 Confirming the deletion

- During the deletion, the result of deleting the label algorithm is displayed in the result display pane below the canvas. Figure 10 Results display

During the deletion, the Filter button on the Filtering tab is grayed out and becomes unavailable.
Feedback
Was this page helpful?
Provide feedbackThank you very much for your feedback. We will continue working to improve the documentation.See the reply and handling status in My Cloud VOC.
For any further questions, feel free to contact us through the chatbot.
Chatbot


