Help Center/
Graph Engine Service/
User Guide/
Analyzing a Graph Using the Graph Editor/
Hiding Sensitive Information of a Graph
Updated on 2025-08-14 GMT+08:00
Hiding Sensitive Information of a Graph
You can use the hide button to control whether to display sensitive information.
Procedure
- Access the GES graph editor page. For details, see Accessing the GES Graph Editor.
- Hiding a label: At the top of the metadata editing page, click the eye icon on the right to hide the label currently shown on the canvas.
Hiding sensitive information about a graph ID: Click the eye icon on the left to hide sensitive information related to the graph ID on the canvas.
Note: If you click only the eye icon on the right, it will hide the graph, and the state will be displayed, along with the graph ID on the canvas.
Figure 1 Hiding sensitive information about a graph ID
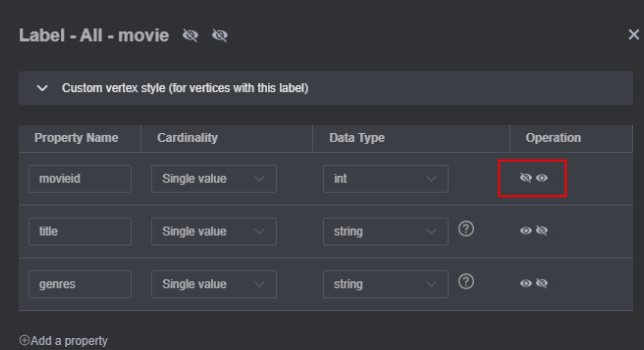
- Hide sensitive information about a property under a label.
In the Operation column of a property in the Schema tab's editing area, click the visibility icon on the right to show of the property on the canvas, and then click the visibility icon on the left to hide sensitive information about the property. Once the settings are complete, click Save.Figure 2 Hiding sensitive information about graph properties

Parent topic: Analyzing a Graph Using the Graph Editor
Feedback
Was this page helpful?
Provide feedbackThank you very much for your feedback. We will continue working to improve the documentation.See the reply and handling status in My Cloud VOC.
The system is busy. Please try again later.
For any further questions, feel free to contact us through the chatbot.
Chatbot


