Viewing Historical SQL Records of DWS
All the historical queries in the current cluster will be displayed. If you do not want to see historical system queries, you can toggle on Hide System Queries.

- Historical queries can be viewed only in clusters of version 8.1.2 and later.
- The historical query monitoring function is disabled by default. To enable it, choose Monitoring Settings. On the Monitoring Collection page, enable Historical Query Monitoring. For details, see Monitoring Collection. Exercise caution when enabling this as it may generate a large amount of data.
Going to the Historical Query Page
- Log in to the DWS console.
- Choose Dedicated Clusters > Clusters and locate the cluster to be monitored.
- In the Operation column of the target cluster, click Monitoring Panel.
- In the navigation pane on the left, choose Monitoring > History.
Checking Historical Queries
In the History area, you can browse all historical query information based on the specified time period. You can click the setting button in the upper right corner of the list to select the metrics to be displayed in the list. For details about the metrics, see Table 1.
|
Metric Name |
Description |
Monitoring Interval (Raw Data) |
|---|---|---|
|
Query ID |
Internal query_ID used for statement execution |
180s |
|
Username |
Username used for connecting to the backend |
180s |
|
Application Name |
Name of the application that is connected to the backend |
180s |
|
Database Name |
Name of the database |
180s |
|
Resource Pool |
Resource pool used by the user |
180s |
|
Submission Time |
Time when a statement is submitted |
180s |
|
Blocking Time (ms) |
Blocking time before statement execution, including statement parsing and optimization time |
180s |
|
Execution Time (ms) |
Duration that a statement has been executed. |
180s |
|
CPU Time (ms) |
Total CPU time of a statement across all DNs. |
180s |
|
CPU Time Skew (%) |
CPU time skew of a statement among DNs. |
180s |
|
Average Spill to Disk (MB) |
Average spilled data among all DNs when a spill occurs. The default value is 0. |
180s |
|
Statement |
Statement executed |
180s |
|
Connected CN |
CN that is connected |
180s |
|
Client IP Address |
IP address of the client connected to the backend. A null value suggests a Unix socket connection or an internal server process, such as autovacuum. |
180s |
|
Query Status |
End status of statement execution: finished for normal and aborted for abnormal. The statement status recorded here should be the database server execution status. When the server-side execution is successful and an error occurs when the result set is returned, the statement should be finished. |
180s |
|
Completion Time |
End time of statement execution |
180s |
|
Estimated Execution Time (ms) |
Estimated execution time of the statement. |
180s |
|
Cancellation Reason |
Reason for canceling the query |
180s |
|
Logical Cluster |
Logical cluster of the user running the statement |
180s |
Viewing Historical Query Monitoring Details
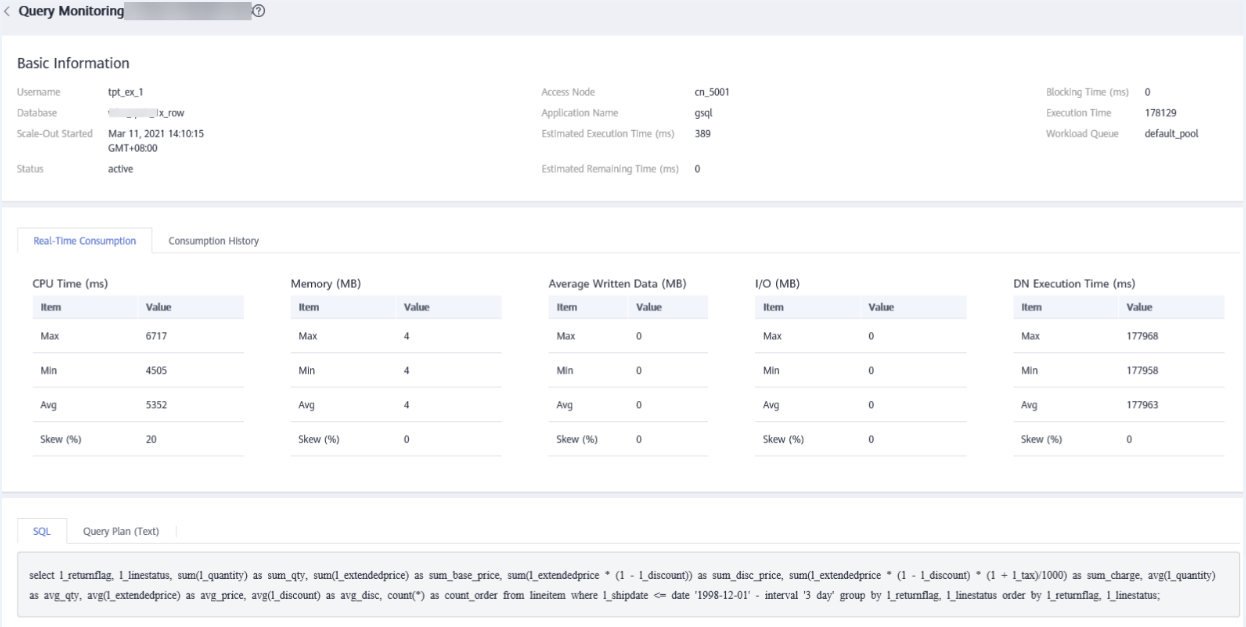
You can click a historical query ID to view the query details, such as basic information about query statements, real-time resource consumption during execution, complete SQL statements, and query plans.

Feedback
Was this page helpful?
Provide feedbackThank you very much for your feedback. We will continue working to improve the documentation.See the reply and handling status in My Cloud VOC.
For any further questions, feel free to contact us through the chatbot.
Chatbot


