Alarms
The IoT platform generates an alarm when it detects that the alarm triggering condition set in a rule is met or the device message reporting rate exceeds the threshold preset on the platform. Pay close attention to the alarms and handle them in a timely manner to ensure the normal device running.
- Rule alarms: If you set the action Report alarms when configuring a device linkage rule and define the alarm properties and severity, the platform reports an alarm when the trigger condition is met. For example, if a smart water meter does not report data for three consecutive days, the platform generates an alarm to notify maintenance personnel of the water meter fault. Maintenance personnel then locate the faulty water meter based on the alarm information and repair it promptly.
- System alarms: When some resources of a user, for example, the number of devices, reach the upper limit of the user quota, IoTDA reports a system alarm to the AOM. This type of alarm is automatically triggered by IoTDA, but notification rules need to be configured. Table 1 lists the system alarms.
Table 1 System alarms Alarm
Description
MQTT Message Flow Control for a Single Device
When the volume of data sent by an MQTT device per second exceeds the threshold (3 KB/s by default), the platform starts flow control on the MQTT device and generates this alarm.
Device Upstream Messages Exceeding the Tenant Flow Control
The sum of the upstream message rate and connection setup rate exceeds the threshold. (PUBLISH indicates upstream message, CONNECT indicates connection setup, and BANDWIDTH indicates bandwidth.) By default, the rate of upstream messages is 500 messages per second in the basic edition, and the rate of link setup is 100 messages per second in the basic edition. For details about the standard and enterprise editions, see Specifications. If the rate exceeds the default value, flow control will be performed and an alarm will be generated.
Number of User Devices Reaching the Threshold
This alarm is generated when the number of registered user devices reaches 80% or 100% of the instance threshold (50,000 for the basic edition, and 20 times of the number of online devices for the standard or enterprise edition. For details, see Specifications).
Number of Online User Devices Reaching the Threshold
This alarm is generated when the number of online user devices reaches 80% or 100% of the threshold. (The threshold depends on the number of purchased units. For the standard or enterprise edition, see Specifications.) When the number of online user devices exceeds the threshold, device access is rejected. The alarm is triggered once an hour.
Number of Child Devices Under a Gateway Reaching the Threshold
This alarm is generated when the number of child devices under a gateway reaches 80% or 100% of the threshold.
Linkage Rule Triggering Concurrency Threshold
This alarm is generated when the number of linkage rules triggered per second exceeds the threshold (10/s for the basic or standard edition and 100/s for the enterprise edition), and flow control is triggered on the excess part. This alarm is triggered only once a day.
Number of API Calls from a Tenant Reaching the Flow Control Threshold
This alarm is generated when the TPS of API calls made by a tenant exceeds the threshold. (Unless otherwise specified, the default limit of an API is 50/s. Maximum number of API calls made by an account per second: 100/s for the basic and standard editions.) Flow control is triggered on the excess part. This alarm is triggered only once a day.
Dafa Forwarding Target Added to the Blacklist
This alarm is generated when the number of data forwarding failures reaches a specified value (10 by default) and the current forwarding target is added to the blacklist.
- Custom metric alarms: You can log in to the AOM 1.0 or AOM 2.0 console to configure custom metric alarms. For details, see Configuring AOM 1.0. Currently, the following metrics are supported.
Table 2 Custom alarm metrics Metric
Name
Total number of devices
iotda_device_status_totalCount
Number of online devices
iotda_device_status_onlineCount
Number of offline devices
iotda_device_status_offlineCount
Number of abnormal devices
iotda_device_status_abnormalCount
Number of inactive devices
iotda_device_status_inactiveCount
Number of activated devices
iotda_device_status_activeCount
Number of online devices (accumulated)
iotda_device_status_dailyOnlineCount
Total number of reported NB-IoT data records
iotda_south_dataReport_totalCount
Number of NB-IoT data reporting failures
iotda_south_dataReport_failedCount
Total number of MQTT event reporting times
iotda_south_eventUp_totalCount
Number of MQTT event reporting successes
iotda_south_eventUp_successCount
Number of MQTT event reporting failures
iotda_south_eventUp_failedCount
Total number of MQTT property reporting times
iotda_south_propertiesReport_totalCount
Number of MQTT property reporting successes
iotda_south_propertiesReport_successCount
Number of MQTT property reporting failures
iotda_south_propertiesReport_failedCount
Total number of MQTT message reporting times
iotda_south_messageUp_totalCount
Number of MQTT message reporting successes
iotda_south_messageUp_successCount
Number of MQTT message reporting failures
iotda_south_messageUp_failedCount
Total number of AMQP transfer times
iotda_amqp_forwarding_totalCount
Number of AMQP transfer successes
iotda_amqp_forwarding_successCount
Number of AMQP transfer failures
iotda_amqp_forwarding_failedCount
Total number of FunctionGraph transfer times
iotda_functionGraph_forwarding_totalCount
Number of FunctionGraph transfer successes
iotda_functionGraph_forwarding_successCount
Number of FunctionGraph transfer failures
iotda_functionGraph_forwarding_failedCount
Total number of MRS Kafka transfer times
iotda_mrsKafka_forwarding_totalCount
Number of MRS Kafka transfer successes
iotda_mrsKafka_forwarding_successCount
Number of MRS Kafka transfer failures
iotda_mrsKafka_forwarding_failedCount
Total number of MQTT transfer times
iotda_mqtt_forwarding_totalCount
Number of MQTT transfer successes
iotda_mqtt_forwarding_successCount
Number of MQTT transfer failures
iotda_mqtt_forwarding_failedCount
Total number of MySQL transfer times
iotda_mysql_forwarding_totalCount
Number of MySQL transfer successes
iotda_mysql_forwarding_successCount
Number of MySQL transfer failures
iotda_mysql_forwarding_failedCount
Total number of InfluxDB transfer times
iotda_influxDB_forwarding_totalCount
Number of InfluxDB transfer successes
iotda_influxDB_forwarding_successCount
Number of InfluxDB transfer failures
iotda_influxDB_forwarding_failedCount
Total number of HTTP message pushing times
iotda_http_forwarding_totalCount
Number of HTTP message push transfer successes
iotda_http_forwarding_successCount
Number of HTTP message push transfer failures
iotda_http_forwarding_failedCount
Total number of OBS transfer times
iotda_obs_forwarding_totalCount
Number of OBS transfer successes
iotda_obs_forwarding_successCount
Number of OBS transfer failures
iotda_obs_forwarding_failedCount
Total number of DMS Kafka transfer times
iotda_dmsKafka_forwarding_totalCount
Number of DMS Kafka transfer successes
iotda_dmsKafka_forwarding_successCount
Number of DMS Kafka transfer failures
iotda_dmsKafka_forwarding_failedCount
Total number of DIS transfer times
iotda_dis_forwarding_totalCount
Number of DIS transfer successes
iotda_dis_forwarding_successCount
Number of DIS transfer failures
iotda_dis_forwarding_failedCount
Total number of ROMA transfer times
iotda_roma_forwarding_totalCount
Number of ROMA Connect transfer successes
iotda_roma_forwarding_successCount
Number of ROMA Connect transfer failures
iotda_roma_forwarding_failedCount
Total number of LTS transfer times
iotda_lts_forwarding_totalCount
Number of LTS transfer successes
iotda_lts_forwarding_successCount
Number of LTS transfer failures
iotda_lts_forwarding_failedCount
Configuring AOM 1.0
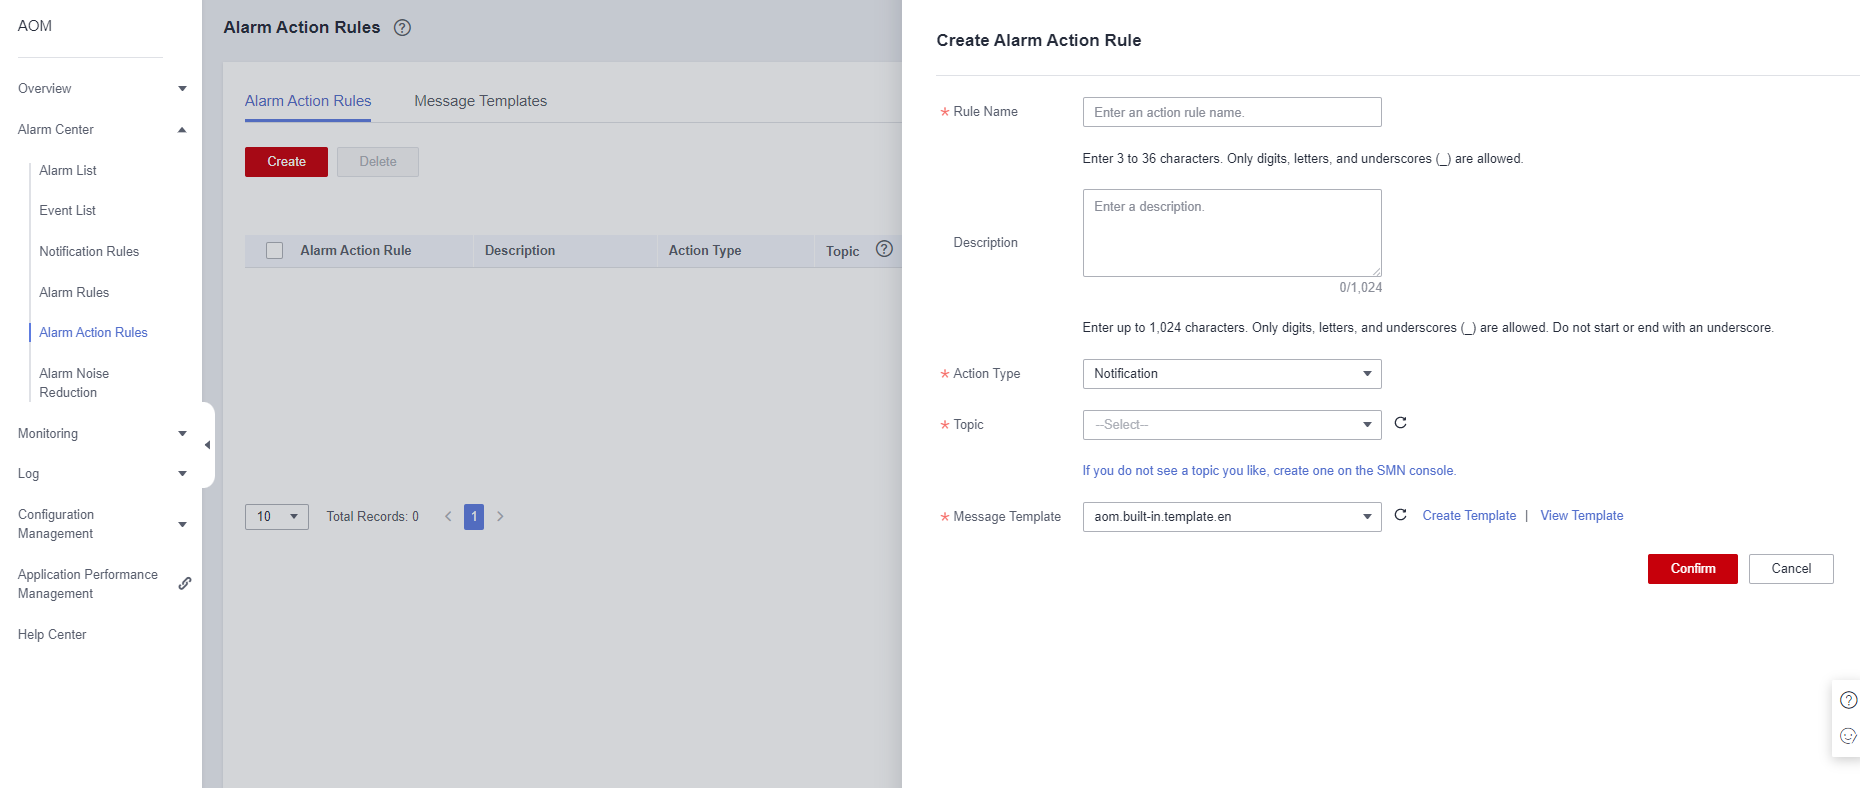
- Log in to the AOM console. In the navigation pane, choose Alarm Center > Alarm Action Rules. Click Create and configure parameters.
Figure 1 Creating an alarm action rule
- In the navigation pane, choose Alarm Center > Alarm Rules. Click Create Alarm Rule in the upper right corner.
- Setting a threshold alarm rule
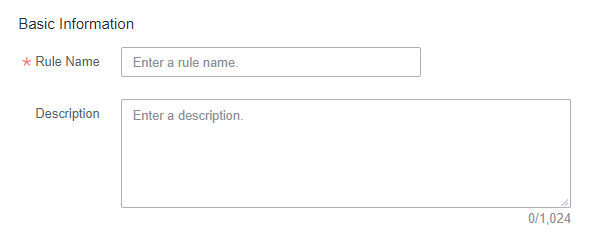
- Set basic information such as the rule name and description.
Figure 2 Setting basic alarm information
- Set details about the rule.
- Set Rule Type to Threshold alarm.
- Set Monitored Object to Command input and enter the corresponding command.
Figure 3 Setting objects to be monitored


Enter Prometheus commands. For details about Prometheus commands, move the cursor to
 next to the search box and click Learn more.
For example, to query the number of DMS Kafka transfer failures in instance A, run the following command: sum(label_replace(sum_over_time(iotda_dmsKafka_forwarding_failedCount{instance="InstanceId of instance A"}[59999ms]),"__name__","iotda_dmsKafka_forwarding_failedCount","",""))by(__name__,instance)
iotda_dmsKafka_forwarding_failedCount indicates the metric name, which can be obtained from Table 2.
- Set Alarm Condition to Custom. In the Trigger Condition area, set trigger condition parameters, such as the statistical period, consecutive period, and threshold condition. For details about the parameters, see Table 3.
Figure 4 Setting alarm conditions

Taking the preceding figure as an example, a minor alarm will be generated when the total number is greater than 10 in three statistical periods.
Table 3 Alarm condition parameters Category
Parameter
Description
Trigger Condition
Statistical Period
Interval at which metric data is collected. By default, only one period is measured. A maximum of five periods can be measured.
Consecutive Periods
When the metric value meets the threshold condition for a specified number of consecutive periods, a threshold alarm will be generated.
Statistic
Method used to measure metrics. Options: Avg., Min., Max., Sum, and Samples.
Threshold Condition
Trigger condition of a threshold alarm. A threshold condition consists of two parts: operators (≥, ≤, >, and <) and threshold value. For example, if Threshold Condition is set to > 85 and an actual metric value exceeds 85, a threshold alarm will be generated.
Alarm Severity
Severity of a threshold alarm. Options: Critical, Major, Minor, and Warning.
Advanced Configuration
Alarm Clearance
An alarm will be cleared if the monitored object does not meet the trigger condition within the monitoring period. By default, metrics in only one period are monitored. You can set up to five monitoring periods.
Action Taken for Insufficient Data
Action to be taken when no metric data is generated or metric data is insufficient within the monitoring period. You can configure this option based on your requirements.
By default, metrics in only one period are monitored. You can set up to five monitoring periods.
Options: Alarm, Insufficient data, Keep previous status, and Normal.
- Configure alarm notifications.
- Set Alarm Mode to Direct Alarm Reporting.
- Select the action rule created in 1.
- Enable Notification.
Figure 5 Setting alarm notifications

- Set basic information such as the rule name and description.
Configuring AOM 2.0
- Log in to the AOM console. In the navigation pane, choose Alarm Management > Alarm Action Rules. On the displayed page, click Create and configure parameters.
Figure 6 Creating an alarm action rule

- In the navigation pane, choose Alarm Management > Alarm Rules. On the displayed page, click Create.
- Enter a rule name, select an enterprise project from the drop-down list, and enter the rule description as required.
Figure 7 Creating an alarm rule

- Set details about the rule.
- Rule Type: Select Metric alarm rule.
- Configuration Mode: Select Select from all metrics.
- Prometheus Instance: Select the target instance.
- Alarm Rule Details: Select Multiple Metrics.
- Metric: Enter iotda in the Metric text box to get related metrics. For details about the metric, see Table 2.
- Conditions: Specify the dimension name, filter criteria, and dimension value.
- Rule: Enter the metric alarm threshold.
- Trigger Condition: Enter the consecutive periods for triggering the alarm.
- Alarm Severity: Select an alarm severity icon.
Figure 8 Setting alarm rules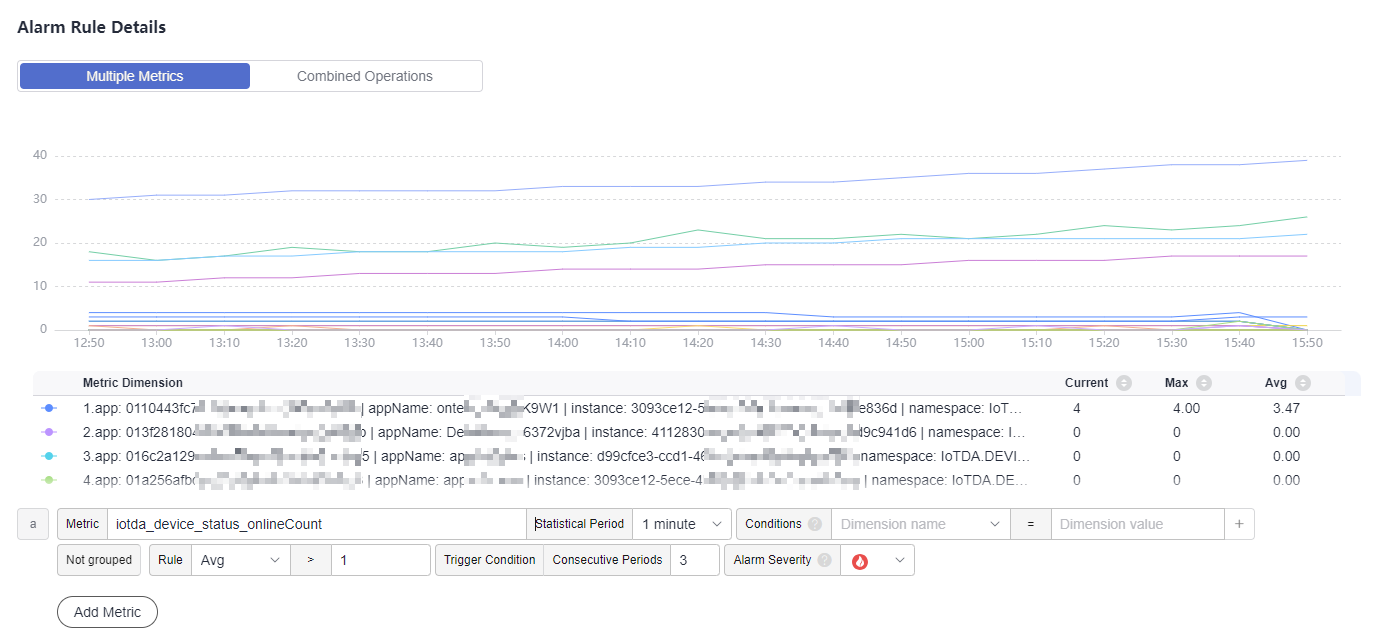
- Set alarm notification. Enable the alarm action rule and select a rule from the drop-down list. If no action rule is available, click the check icon on the right to go to the page for creating an alarm action rule.
Figure 9 Setting alarm rules

AOM 2.0 Alarms
- Log in to the AOM console. In the navigation pane, choose Alarm Center > Alarm Rules. On the displayed page, click Create Alarm Rule and configure parameters.
Figure 10 Alarm rules

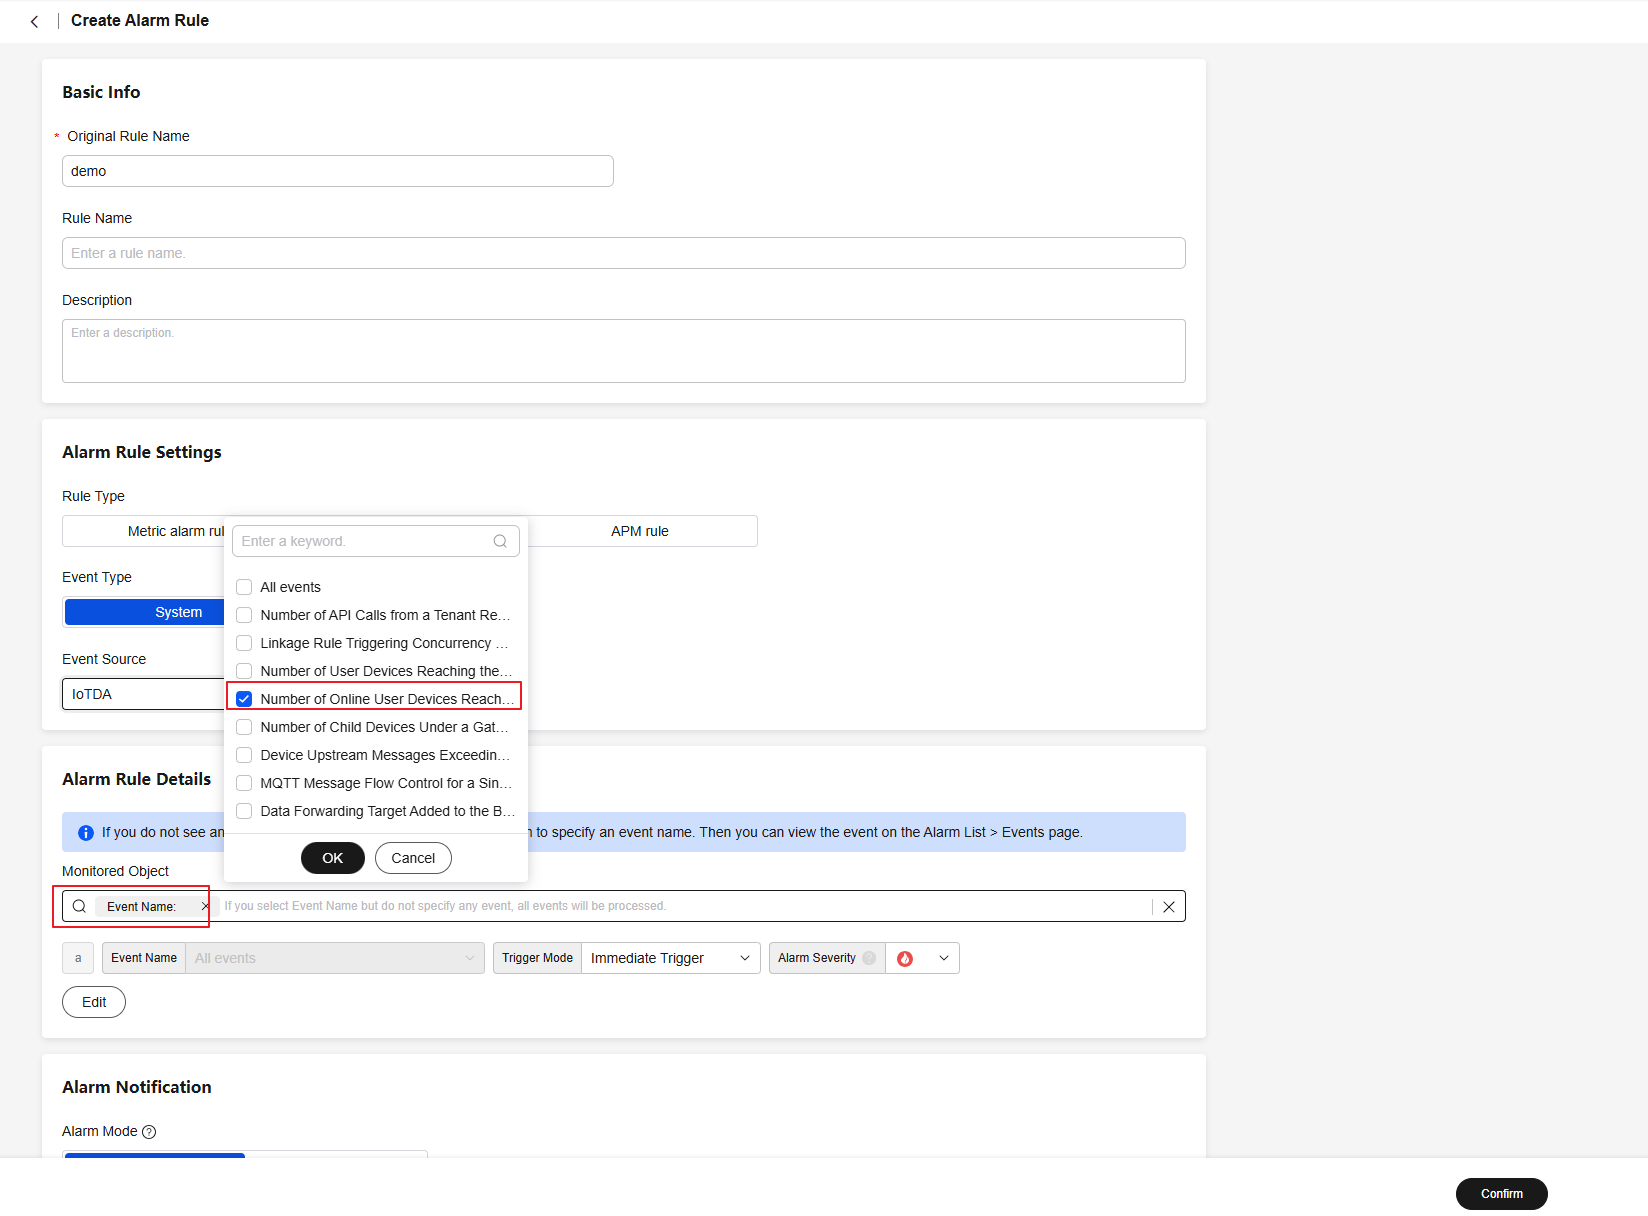
- After setting basic parameters, set the alarm rule as shown in the following figure. Set Rule Type to Event alarm rule, Event Type to System, and Event Source to IoTDA. In the Alarm Rule Details area, set Monitoring Object to the event of the user device quantity reaching the threshold.
Figure 11 Configuring alarm rules
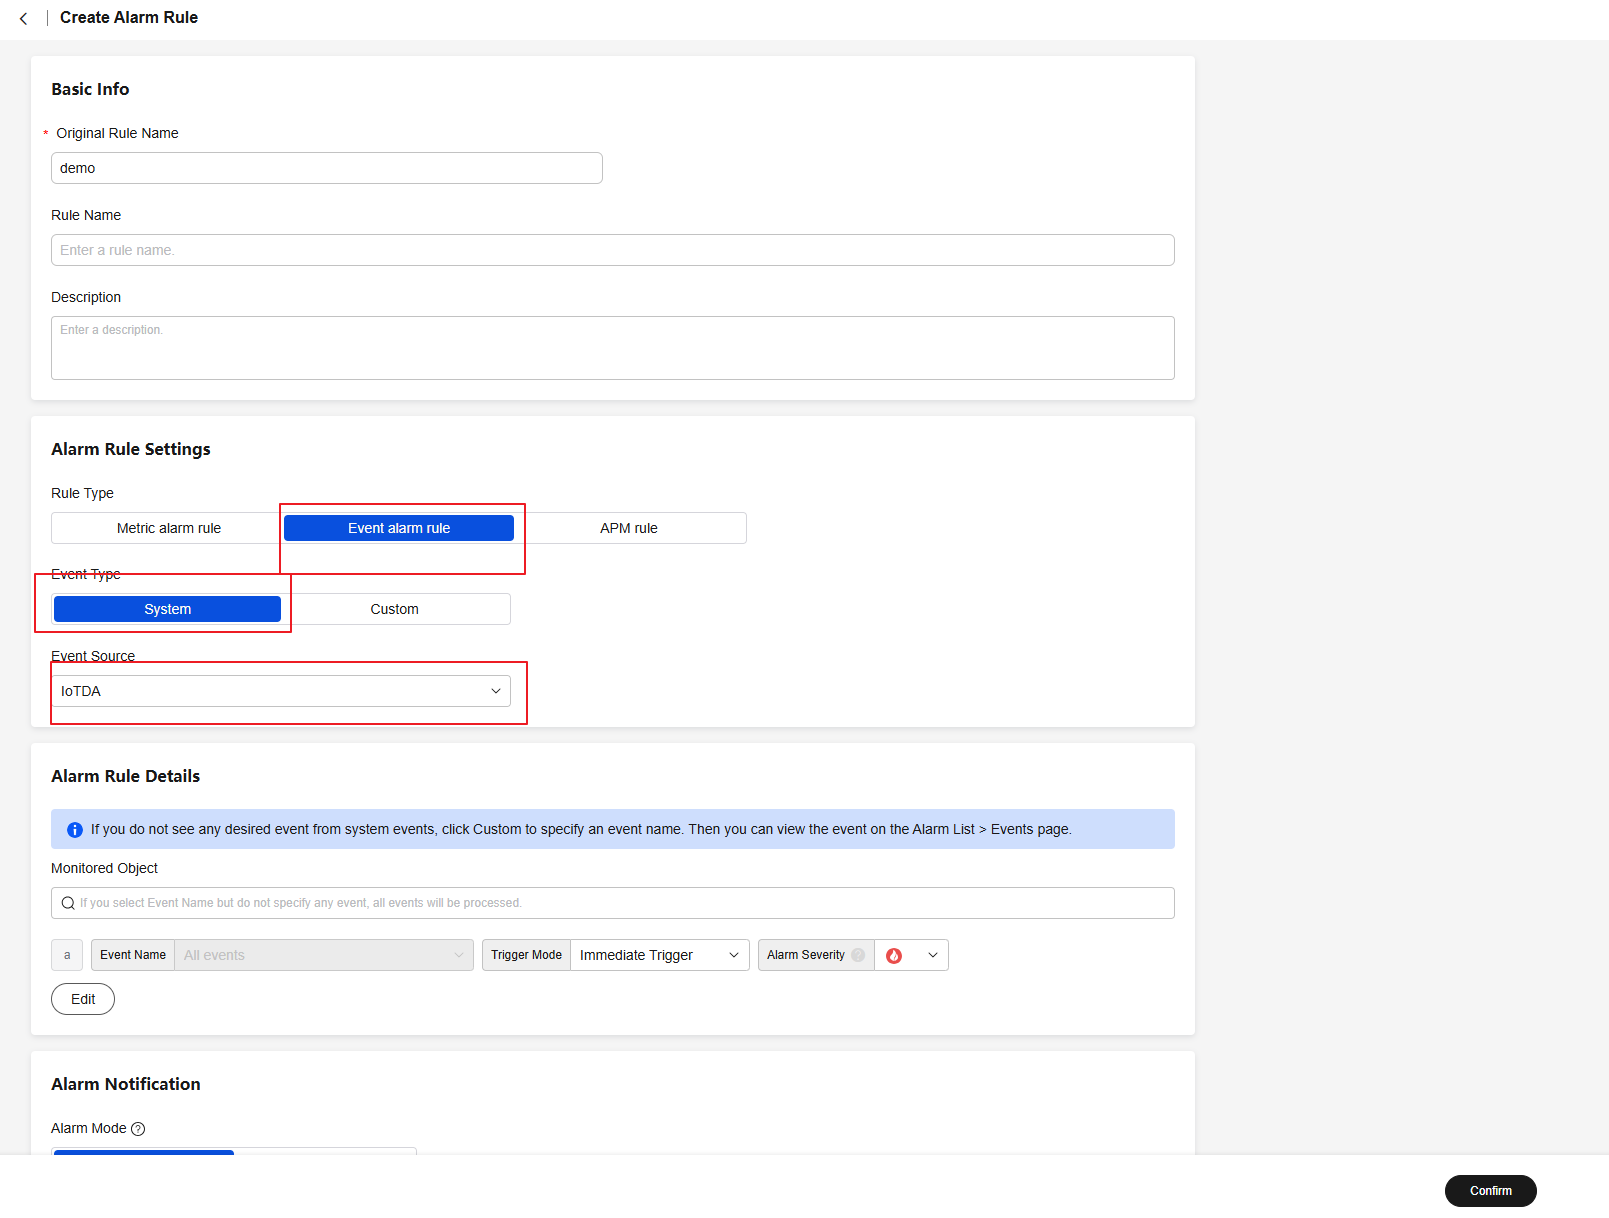 Figure 12 Alarm rule details
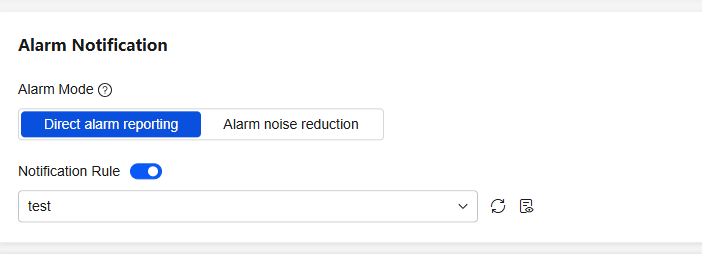
- Configure a notification rule: After an alarm is triggered, the alarm is pushed to the client that subscribes to the alarm based on the rule.
Figure 13 Alarm notification rules
- Click Create Now.
Checking Alarm Information
- Access the IoTDA service page and click Access Console. Click the target instance card.
- In the navigation pane, choose O&M > Device Alarms. Click Application Operations Management (AOM) to access the AOM console and view alarms generated for IoTDA.
- Click an alarm to check the alarm details.
Figure 14 Viewing alarm details

- Clear an alarm. After the fault is rectified, click
 in the Operation column of the target alarm.
Feedback
Was this page helpful?
Provide feedbackThank you very much for your feedback. We will continue working to improve the documentation.See the reply and handling status in My Cloud VOC.
For any further questions, feel free to contact us through the chatbot.
Chatbot


