Intelligent Insights
Intelligent insights provide a series of functions including anomaly detection, intelligent insights generation, and automatic insights (Table 1), helping you improve the accuracy of intelligent data insight and data analysis efficiency. This section describes how to use the features related to intelligent insights.
|
Feature |
Description |
|---|---|
|
Anomaly detection efficiently detects abnormalities in measures or metrics in data tables, suitable for scenarios requiring identification of data anomalies. |
|
|
Intelligent insights can autonomously analyze your business data and provide targeted business suggestions, suitable for scenarios requiring business decision support. |
|
|
Automatic insights automatically identify data anomalies and trends based on chart data, further exploring deeper questions and attribution, suitable for comprehensive data analysis scenarios. |
|
|
Root cause analysis focuses on exploring the reasons for fluctuations in measures or metrics over time, suitable for quickly identifying problems and finding the root cause of issues. |
Prerequisites
- A project has been created by referring to Creating a Project.
- A data source has been connected by referring to Connecting to a Data Source.
- A dataset has been created by referring to Creating a Dataset.
- An intelligent analysis assistant has been created by referring to Creating an Intelligent Analysis Assistant.
Anomaly Detection
Anomaly detection efficiently detects abnormalities in metrics or indicators in data tables, helping you take timely actions and improve business performance.
- In the navigation pane on the left, choose Q&A Management > Intelligent Analysis Assistants. On the displayed page, locate your desired assistant and click Q&A in the Operation column. On the page that appears, generate a chart based on the Q&A.
- Click Analyze in the lower left corner of the generated chart and select Detect Anomaly. On the displayed page (Figure 1), set the parameters based on Table 2.
Table 2 Parameters for anomaly detection Parameter
Description
Select Metric
Metrics in the data table.
Algorithm Type
- Intelligent detection
- You only need to configure metrics or indicators and click OK to detect exceptions.
- Anomaly detection results include identifying exceptions on charts and describing each exception in natural language.
- Threshold detection
- You need to configure the metrics or indicators, threshold detection type, and threshold range, and click OK to detect exceptions.
- If there is only one dimension in the chart and the dimension value is ordinal time series, the available threshold detection types include Absolute threshold, Change threshold, and Change rate threshold. In other cases, only Absolute threshold is available.
- The threshold range is determined by the left and right values. The left and right values cannot be empty at the same time. If neither of them is empty, the left value must be less than the right value. Otherwise, you cannot click OK to perform anomaly detection.
- Anomaly detection results include identifying exceptions on charts and describing each exception in natural language. When Threshold Detection Type is set to Absolute threshold, the dotted line is used to mark the threshold in the chart.
Threshold Detection Type
There are three types of threshold detection: Absolute threshold, Change threshold, and Change rate threshold. The display of detection types depends on the chart data.
Threshold Settings
If the left side is empty, it represents negative infinity. If the right side is empty, it represents positive infinity. Both cannot be empty at the same time.
- Intelligent detection
- After setting the parameters, click OK to generate anomaly detection (Figure 2).
Intelligent Insights
Intelligent insights generation can analyze your business data and provide targeted business recommendations, helping you make better business decisions.
- In the navigation pane on the left, choose Q&A Management > Intelligent Analysis Assistants. On the displayed page, locate your desired assistant and click Q&A in the Operation column. On the page that appears, generate a chart based on the Q&A.
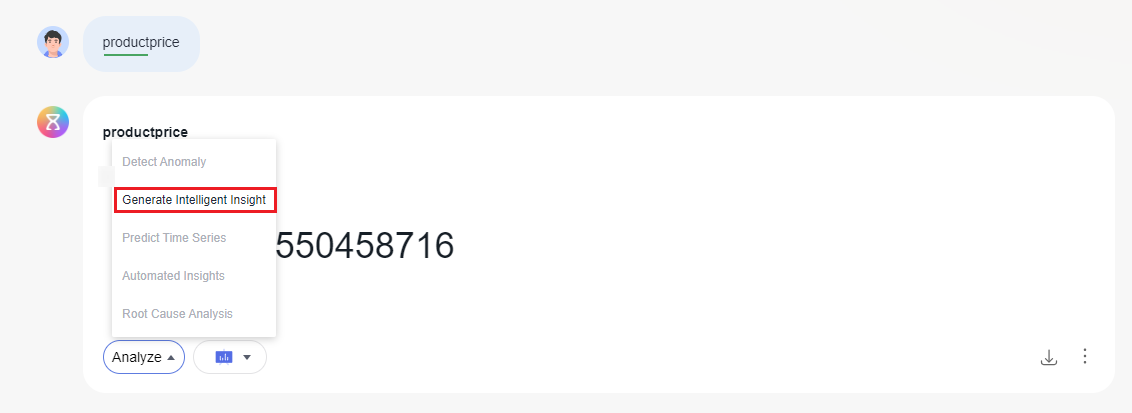
- Click Analyze in the lower left corner of the chart and select Generate Intelligent Insight.
Automatic Insights
Automatic insights identify data features based on chart data, exploring deeper questions and attribution for comprehensive data analysis.
- Restrictions
- A chart must have at least one dimension and one metric.
- Derivative indicators are not supported.
- The chart is invalid when the number of dimensions is greater than 3.
- Procedure
- Choose Data Management > Datasets. On the displayed page, click Visual Configuration.
- By setting the priority of the product_name field to high, automated insights will prioritize analyzing data based on this high-priority field.
- Click Save in the upper right corner.
- In the navigation pane on the left, choose Q&A Management > Intelligent Analysis Assistants. On the displayed page, locate the desired assistant and click Q&A in its Operation column.
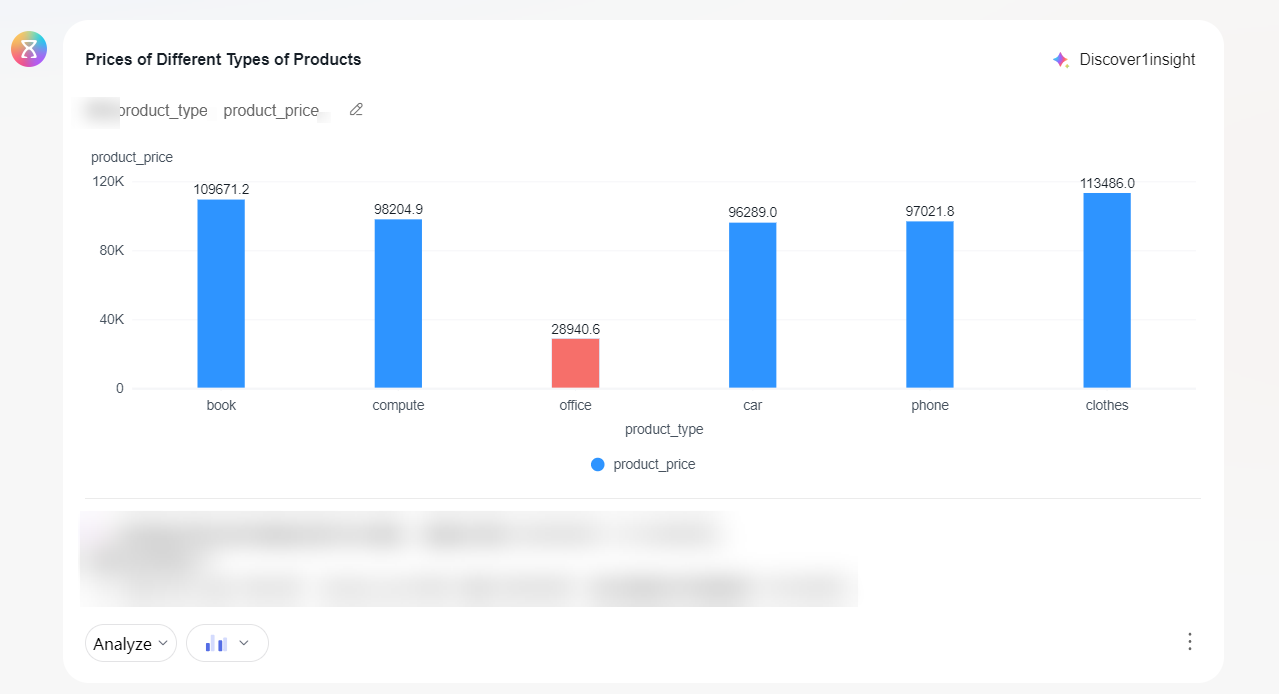
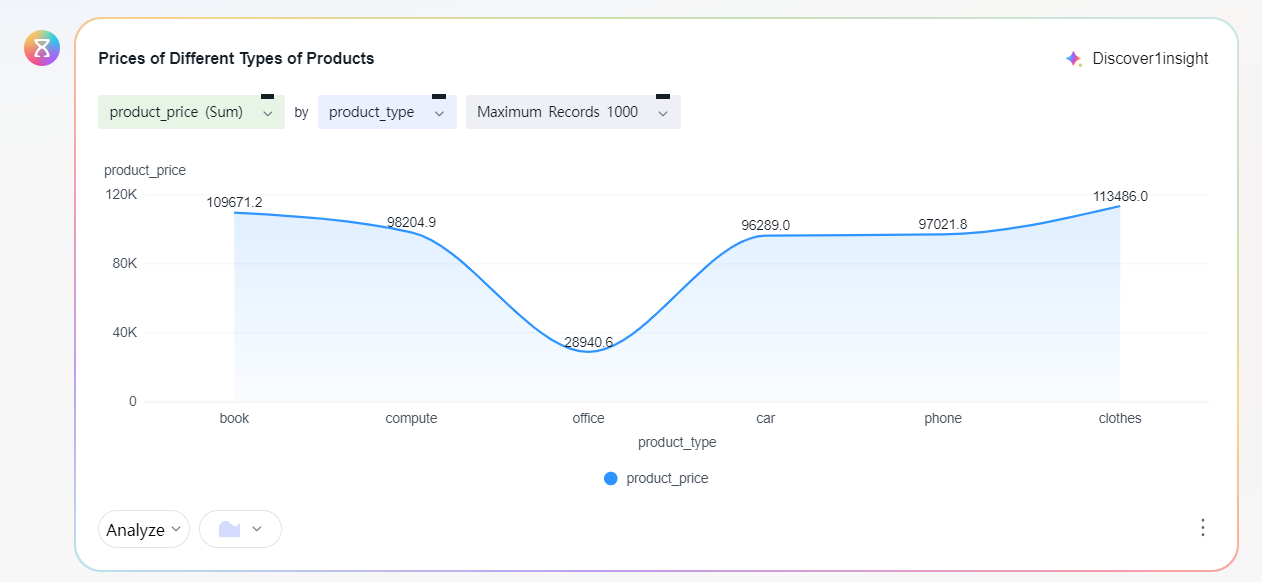
- Ask the question on the intelligent data insight page: What is the price of different types of products? (Figure 4)
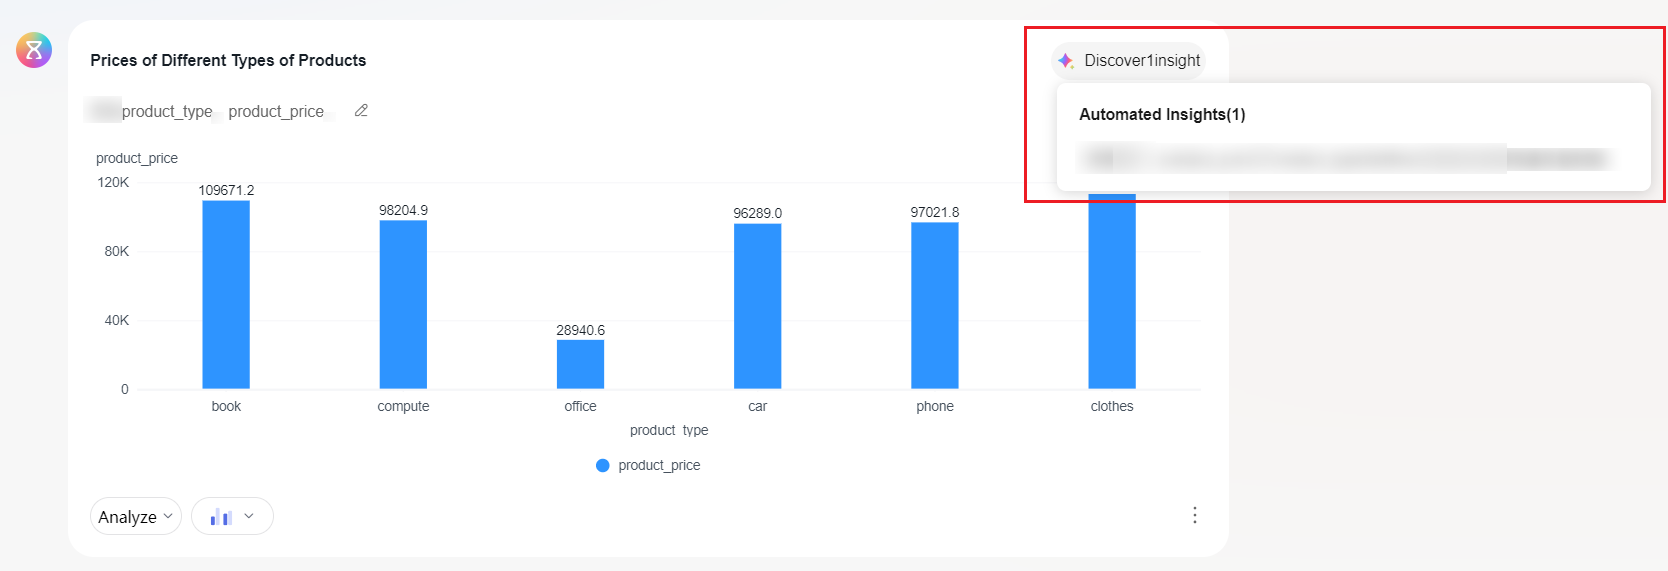
- Move the cursor to Discover1insight in the upper right corner of the chart (Figure 5).
- Click the question generated by automatic insights, and the intelligent data insight page will show automatic insights (Figure 6).
Root Cause Analysis
Root cause analysis focuses on deeply exploring the reasons for fluctuations in dimensions, measures, or metrics over time, helping you quickly identify problems and take effective actions to optimize business processes.
- Restrictions
- The chart's horizontal axis must be a time dimension with ordered time values, and there must be at least two time values. Otherwise, Root Cause Analysis will be grayed out.
- The aggregation types of metrics/indicators in the chart must be those listed in Table 3; otherwise, Root Cause Analysis is grayed out.
- A maximum of 5 analysis dimensions and 10 analysis metrics can be selected.
- Procedure
- In the navigation pane on the left, choose Q&A Management > Intelligent Analysis Assistants. On the displayed page, locate your desired assistant and click Q&A in the Operation column. On the page that appears, generate a chart based on the Q&A.
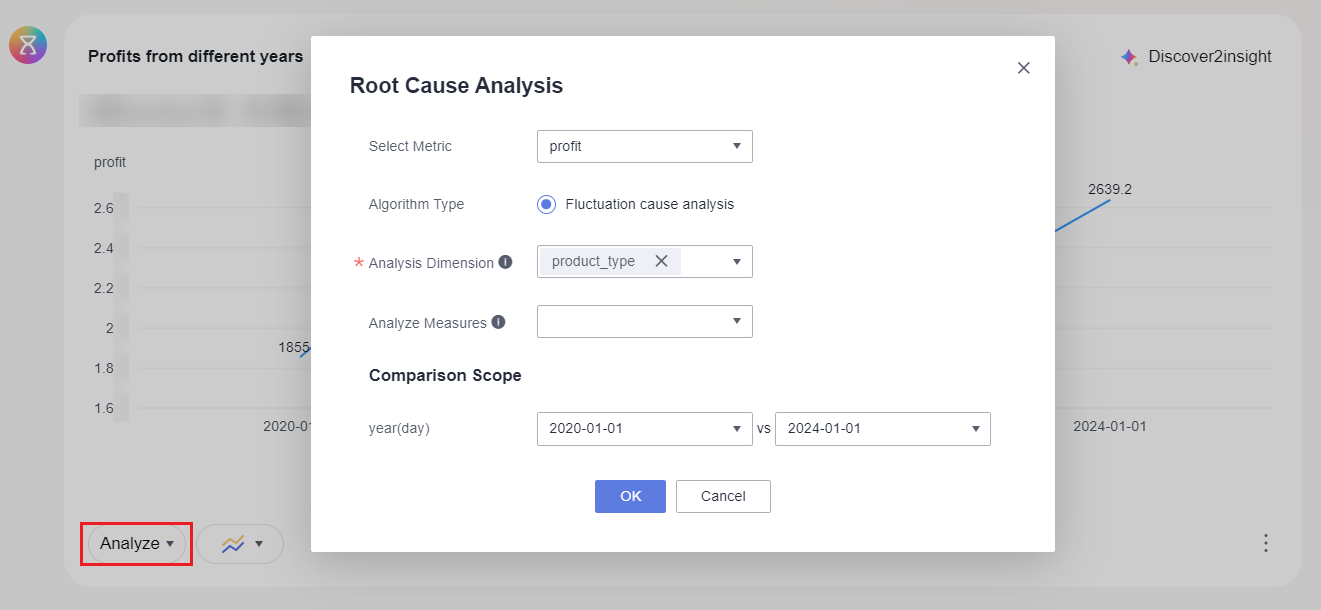
- Click Analyze in the lower left corner of the chart and select Root Cause Analysis. On the page that appears, set the parameters and click OK. For how to set the parameters, refer to Table 3.
Table 3 Parameters for a root cause analysis Parameter
Description
Select Metric
The aggregation types of metrics and indicators in a data table must be:
- Indicator aggregation types
- Type 1: SUM(M), COUNT(M), SUM(M1)+SUM(M2), SUM(M1)-SUM(M2), SUM(M) x constant, SUM(M)/constant
- Type 2: SUM(M1)/SUM(M2), AVG(M), AVG(M1)/AVG(M2)
- Metric aggregation types: SUM(M), COUNT(M)
Algorithm Type
The only option is Fluctuation cause analysis.
Analysis Dimension
Choose one or more dimensions from all dimensions of the dataset, except for the time dimension on the chart and the dimensions involved in the filter conditions, as the analysis dimensions. Currently, you can only select a maximum of five analysis dimensions.
Analysis Metric
Choose one or more metrics from all metrics of the dataset, except for the time dimension on the chart and the metrics involved in the filter conditions, as the analysis metrics. Currently, you can only select a maximum of 10 analysis metrics.
Comparison Scope
Two time dimension values on the chart, which are used to specify the analysis range of metric fluctuations.
- Indicator aggregation types
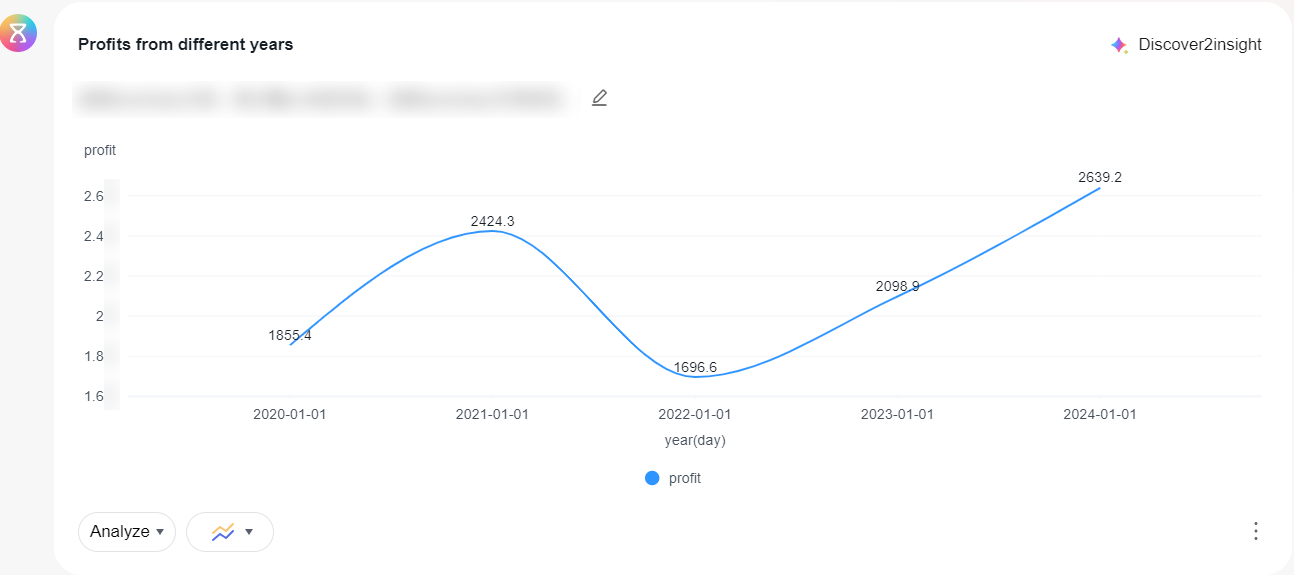
- Example: Compare the total profit of a product from 2020 to 2024.
- On the intelligent analysis assistant's Q&A page: profit of products in different years.
Figure 7 Profits of products in different years
- Click Analyze and select Root Cause Analysis. In the dialog box that appears (Figure 8), set the parameters and click OK. The analysis result is displayed on the Q&A page.
- On the intelligent analysis assistant's Q&A page: profit of products in different years.
Feedback
Was this page helpful?
Provide feedbackThank you very much for your feedback. We will continue working to improve the documentation.See the reply and handling status in My Cloud VOC.
For any further questions, feel free to contact us through the chatbot.
Chatbot


