
Static Data Datasets
Static data can be entered manually or imported from an Excel or CSV file.
Creating a Dataset
- Log in to Huawei Cloud Astro Canvas by referring to Logging In to Huawei Cloud Astro Canvas.
- Choose Data Center from the main menu.
- Choose Datasets > All in the navigation pane.
- On the Dataset Management page, click Create.
- On the page for adding a dataset, set the dataset name, select the data type and folder, and click Save.
Figure 1 Setting dataset parameters
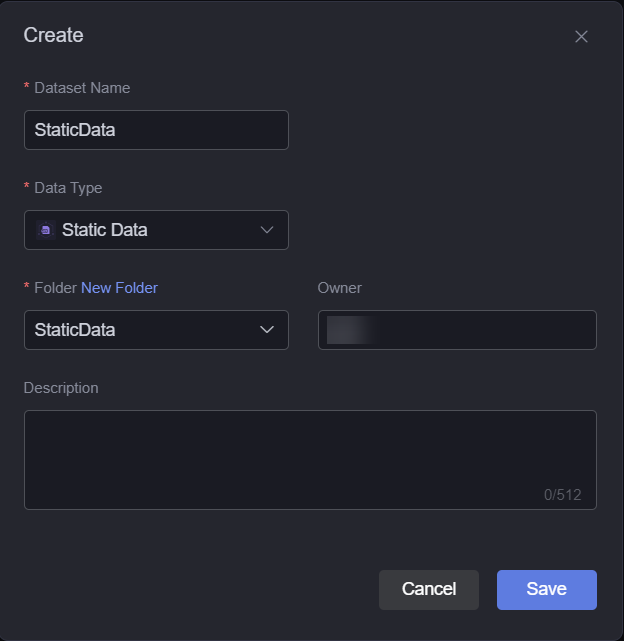
- Dataset Name: A dataset is identified by its name. The name contains 1 to 60 characters, including letters, digits, and underscores (_).
- Data Type: Select Static Data.
- Folder: Specify a folder for the dataset. You can select a folder created in (Optional) Creating a Folder. You can also click New Folder to create a folder, or use a preset folder (preset classification).
- Owner: Creator of the dataset.
- Description: Description of the new dataset, which is usually the function of the dataset.
- You can manually input static data or import it from an Excel or CSV file.
- Input data manually: On the data configuration page on the right, click
 and enter the corresponding data. To add a column or row, click Add Column or Add Row. To delete a row, select the row and click Delete Selected Row. To clear all content, click the button for clearing the list.
Figure 2 Entering static data
and enter the corresponding data. To add a column or row, click Add Column or Add Row. To delete a row, select the row and click Delete Selected Row. To clear all content, click the button for clearing the list.
Figure 2 Entering static data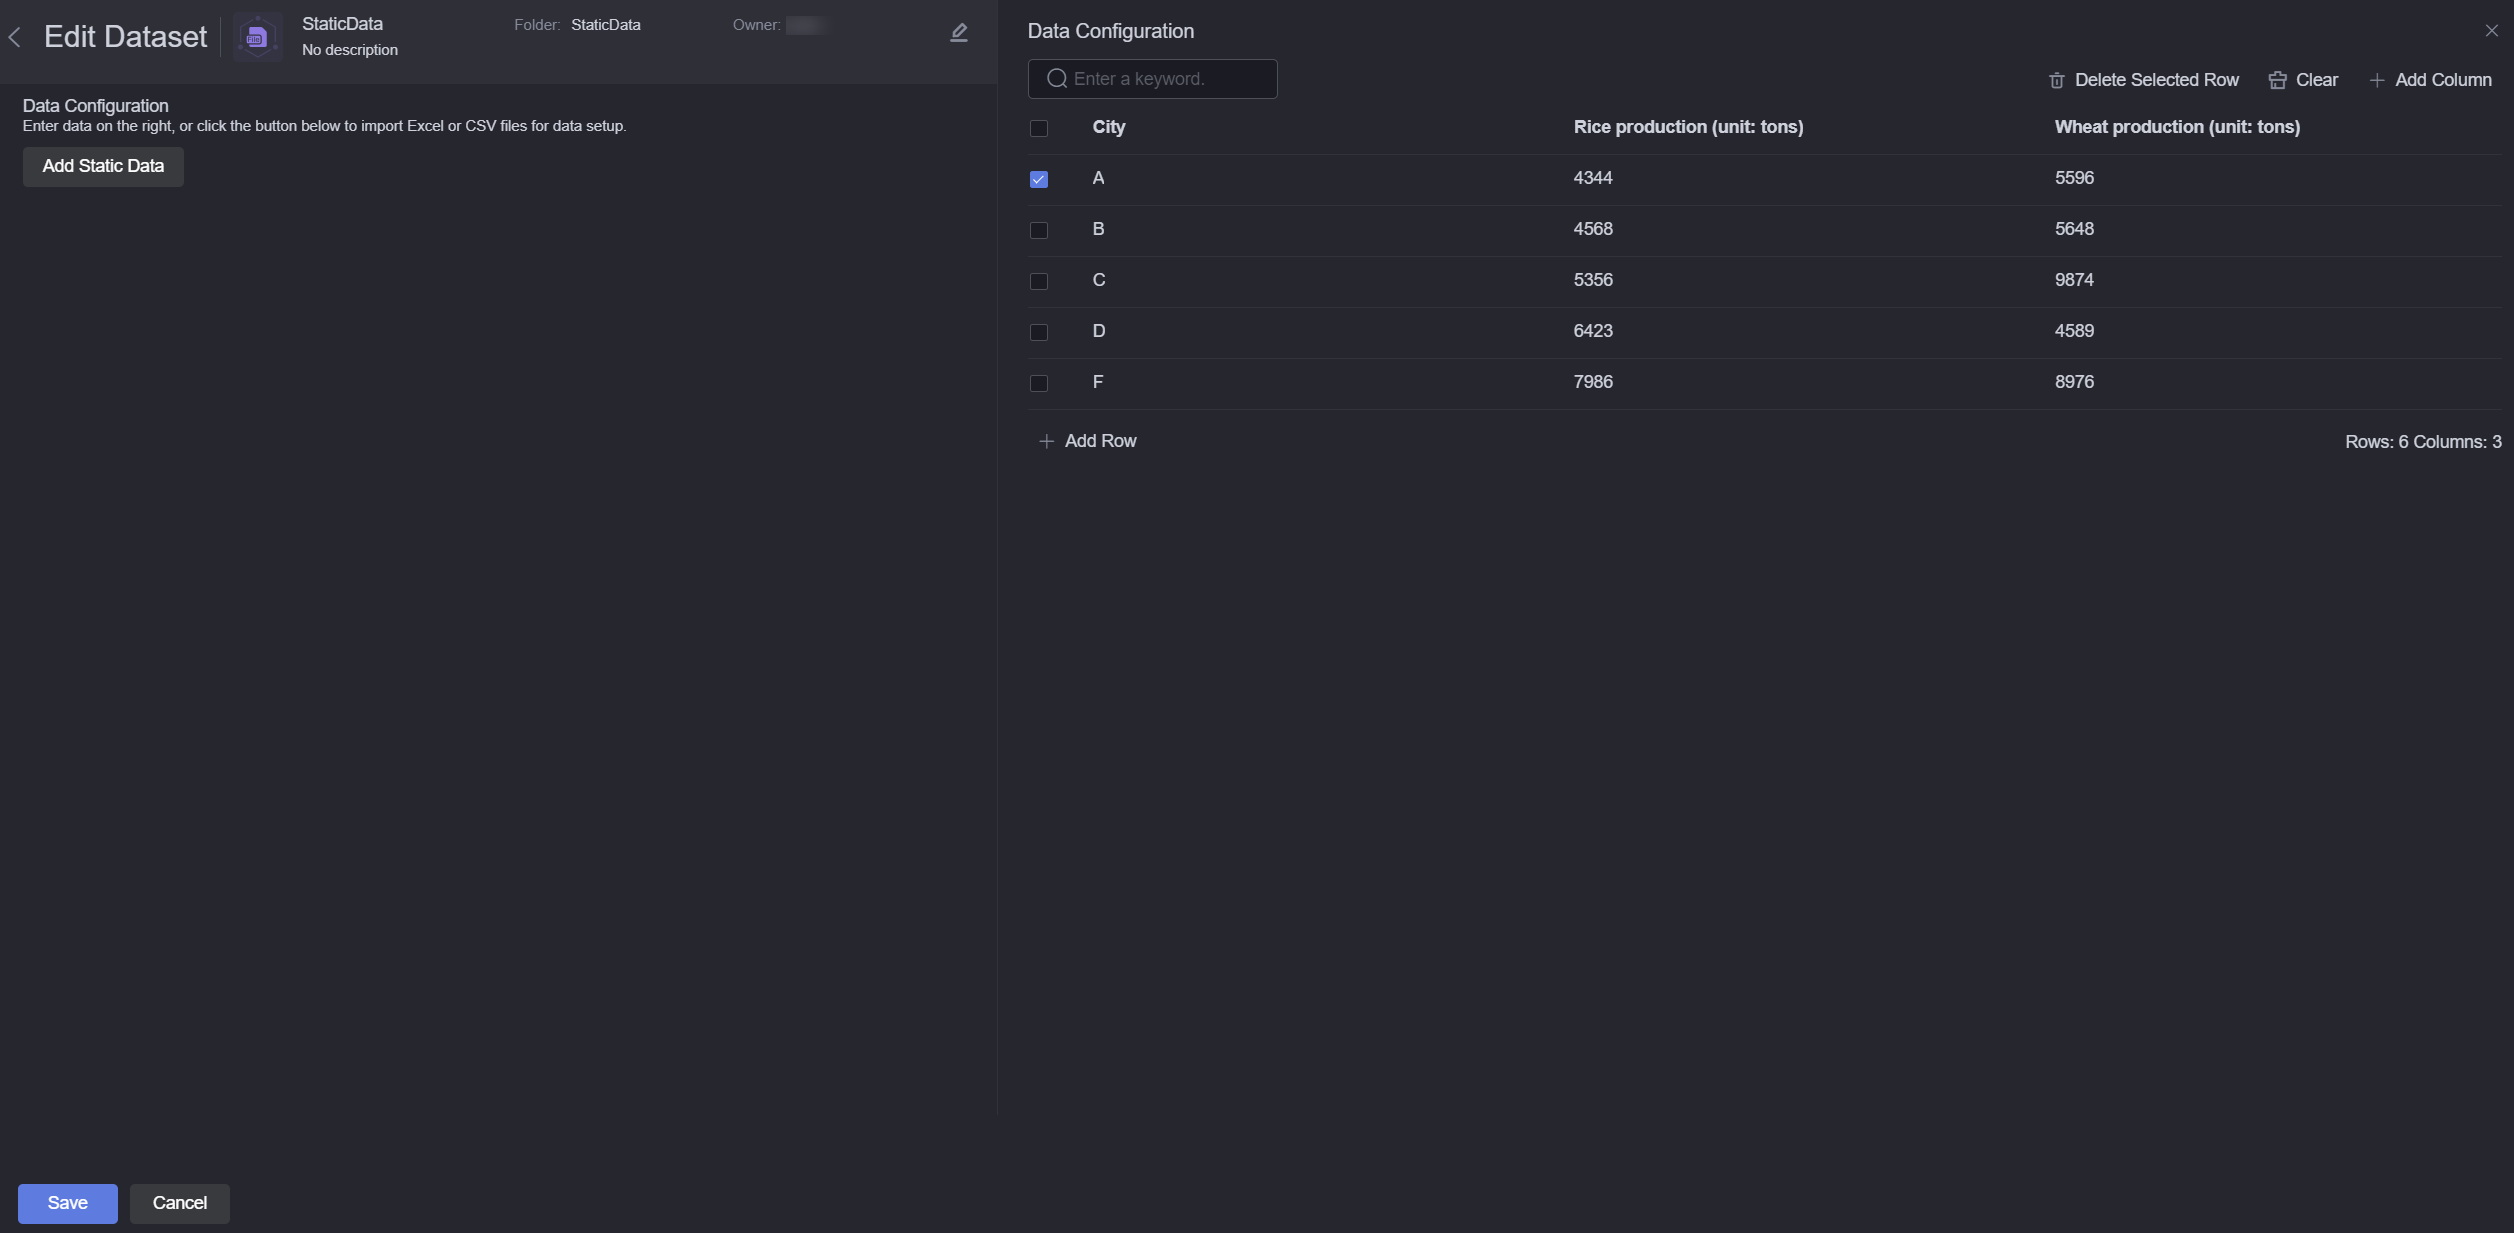
Move the cursor to a column and click ... to edit, delete, copy, insert a column on the left, or insert a column on the right.
Figure 3 Editing a column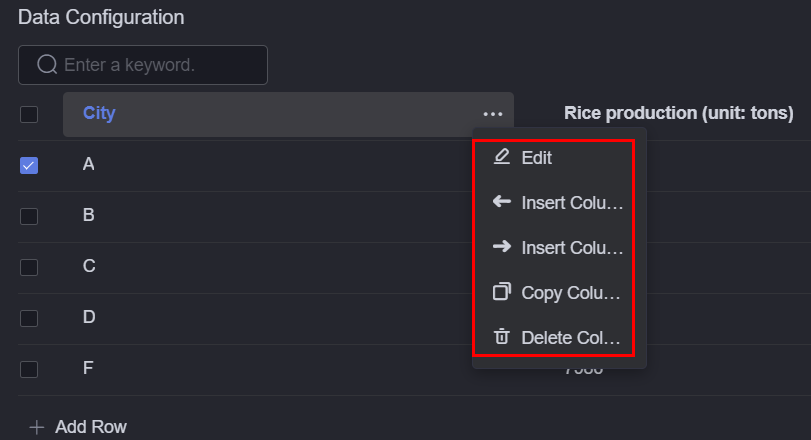
- Import data from Excel or CSV files
Click the button to add static data, drag a local Excel or CSV file (Max. 100 KB) to the upload area, and click Confirm.
- Input data manually: On the data configuration page on the right, click
- Click Save. The dataset is created.
In the Dataset Management page, you can view the created dataset.
Using Datasets in Widgets
- Return to the Projects page.
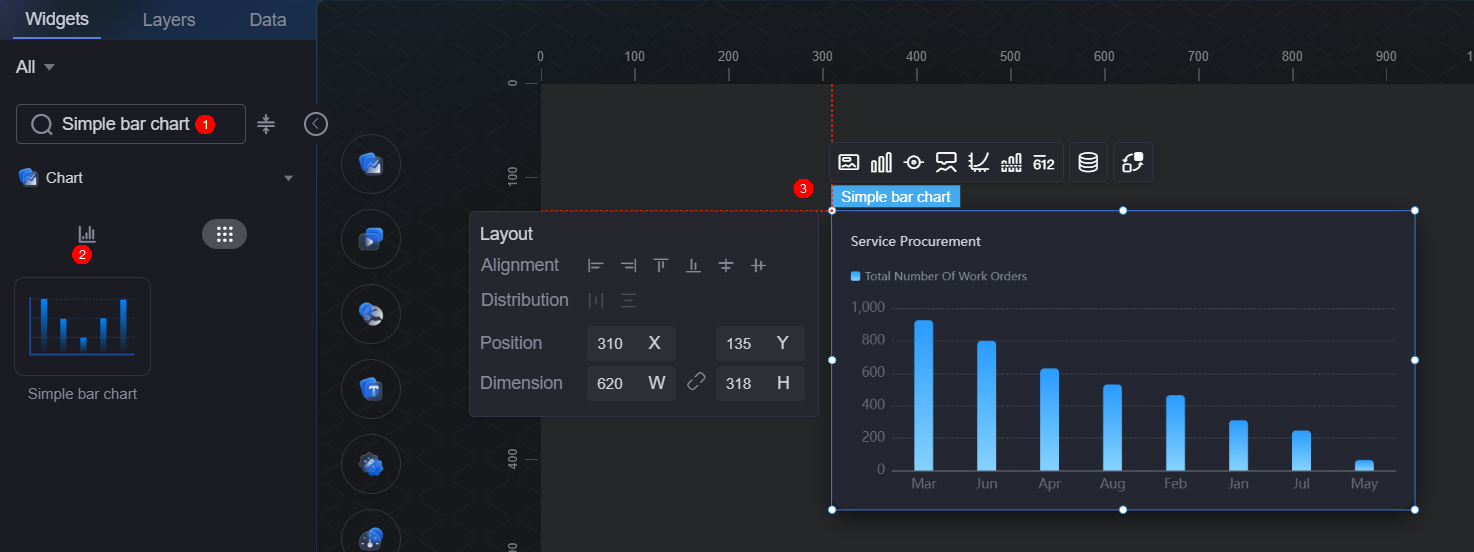
- Go to the development page and drag required widgets (for example, basic bar chart) to the canvas.
Figure 4 Dragging a basic bar chart widget to the canvas
- Select the widget and click
 .
. - Select Dataset from the Data Type drop-down list and select the dataset created in Creating a Dataset.
- Set global variables.
Global variables can be regarded as parameter variables and used to control parameter transfer between widgets for interaction functions such as diagram and table association and field customization. Global variables cannot be configured for static data.
- In Widget Preview, select the form fields to be displayed by dragging them from the left column to the right column, and click Save.
Figure 5 Dragging a field to the corresponding axis
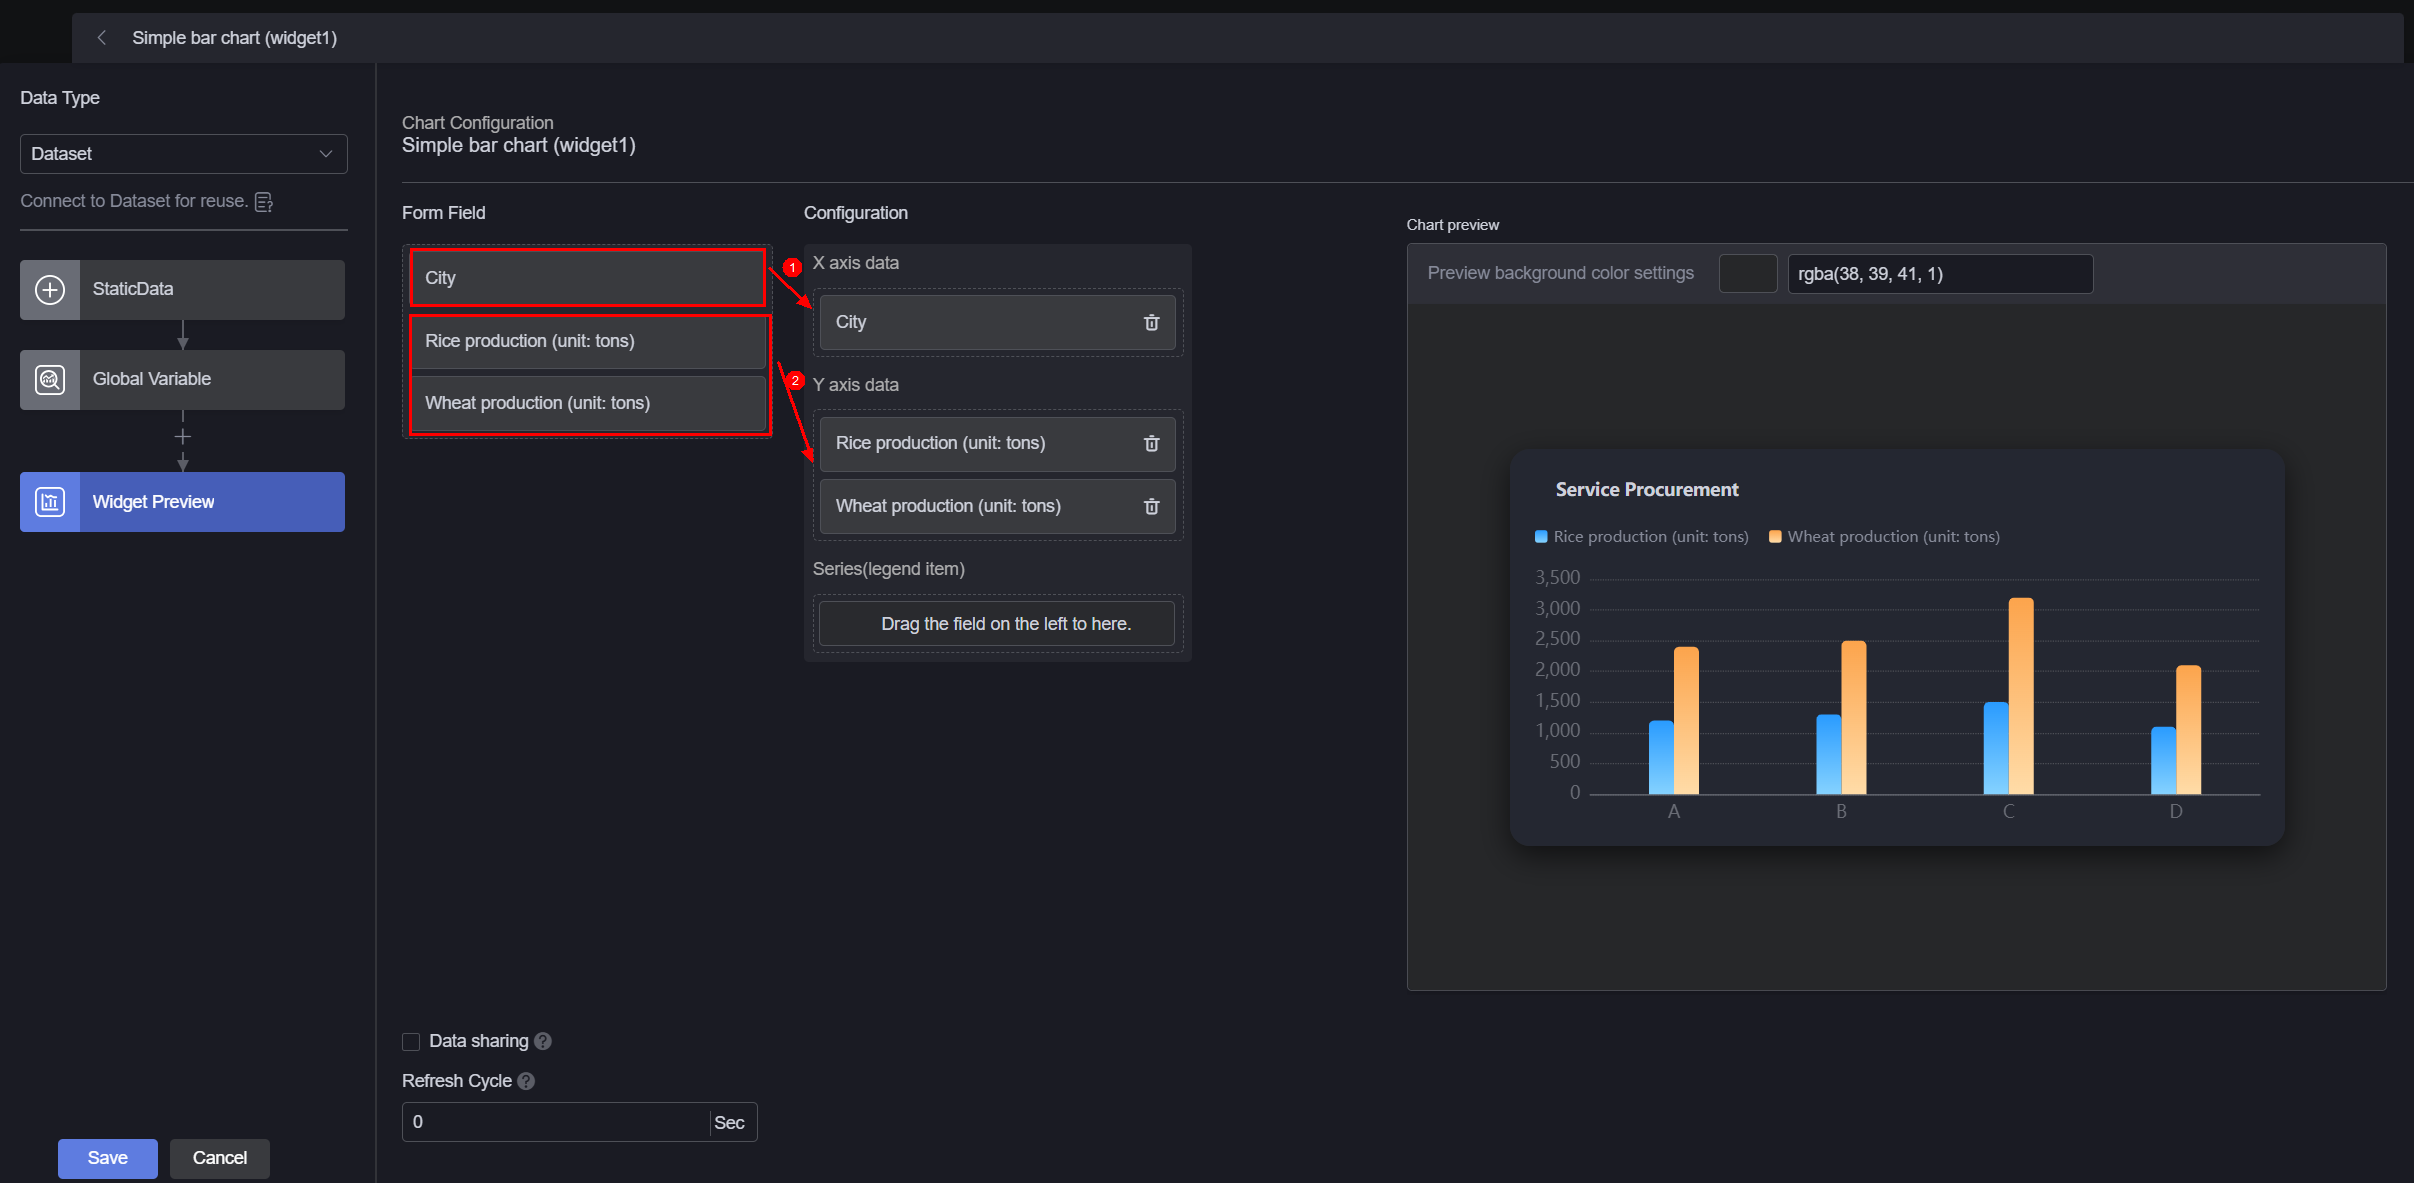
- Form field: Static data recorded in Creating a Dataset.
- Configuration: Drag the required fields from the form field area to the X-axis data, Y-axis data, or series.
- Refresh cycle: The interval for obtaining static data. Default is 0, meaning the data is obtained only once.
- Data sharing: When enabled, multiple widgets calling the same static data request will share the result data.
- Select the bar chart widget, click
 , and set the title to "Crop output statistics of each city".
Figure 6 Setting the chart title
, and set the title to "Crop output statistics of each city".
Figure 6 Setting the chart title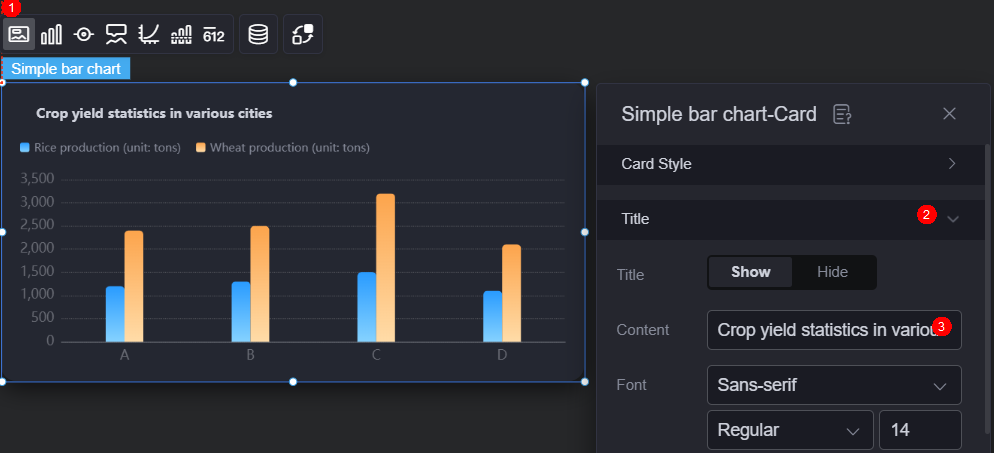
- Click
 in the upper part of the page to save the settings.
 - Click
 to preview.
Feedback
Was this page helpful?
Provide feedbackThank you very much for your feedback. We will continue working to improve the documentation.See the reply and handling status in My Cloud VOC.
For any further questions, feel free to contact us through the chatbot.
Chatbot


