
Integrating Windows Configuration Logs into SecMaster
This topic describes how to integrate Windows configuration logs into SecMaster.
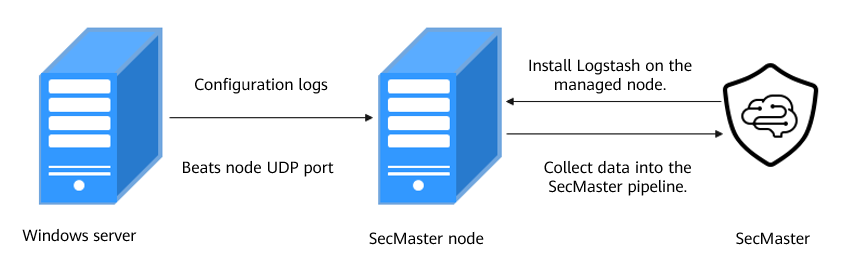
Windows OSs cannot directly forward logs. SecMaster uses Filebeat, a lightweight log collector, to send Windows configuration logs to the node over corresponding UDP port. Then, SecMaster parses the logs using system log parsers to analyze and send parsed data to SecMaster. After enabling log integration, you can query them on the page.
| (Optional) Step 1: Buy an ECS | Buy an ECS for installing the log collector. |
|---|---|
| (Optional) Step 2: Buy a Data Disk | Buy a data disk to ensure that there is enough space for running the log collector. The data disk and ECS must be in the same AZ, and the data disk capacity cannot be less than 100 GB. |
| (Optional) Step 3: Attach a Data Disk | You need to attach a data disk to the ECS used for the log collector to make sure there is enough space for running the log collector. |
| Create a non-administrator IAM user and password for logging in to SecMaster from the log collector. | |
| Step 5: Configure Network Connection | Before collecting data, you need to establish the network connection between the tenant VPC and SecMaster. |
| Manage the log collector node (ECS) on SecMaster. | |
| Configure the log collection process. | |
| Step 8: Create a Log Storage Pipeline | Create a log storage location (pipeline) in SecMaster for log storage and analysis. |
| Step 9: Configure a Connector | Configure the log source and destination parameters. |
| Step 10: Configure a Log Collection Channel | Connect all function components to ensure that SecMaster and the log collector work properly. |
| Step 11: Configure Windows Log Forwarding | Collect remote logs through the Filebeat service. |
| Step 12: Start Security Query and Analysis | After logs are integrated into the SecMaster pipeline, you can query logs on SecMaster. |
Notes and Constraints
- The component controller (isap-agent) of the log collector can only run on a Linux x86 or Arm ECS.
- Only a non-administrator IAM user can log in to the console and check information for installing the component controller (isap-agent).
Prerequisites
- You have enabled the paid SecMaster and created a workspace.
For details, see Buying SecMaster and Creating a Workspace.
Procedure for Integrating EulerOS Logs into SecMaster
- Prepare an ECS and install the log collector on the ECS for log collection. Make sure the system disk capacity for the ECS is not less than 50 GB.
If you already have an ECS that meets the requirements, skip this step.
If you need to buy an ECS, see Buying an ECS.
- Buy data disks to ensure that there is enough space for the log collector to run properly.
An idle data disk with capacity not less than 100 GB is required for the ECS you plan to install the log collector. This data disk is used for collection management. The data disk must be in the same AZ as the ECS.
If you have purchased an ECS and configured data disks by referring to (Optional) Step 1: Buy an ECS, skip this step. Otherwise, refer to (Optional) Step 2: Buy a Data Disk to buy or apply for a data disk.
- Attach the data disk to the ECS that meets the requirements.
Attach the data disk to the ECS that meets the requirements to ensure that there is enough space for the log collector to run properly. For details, see Attaching a Data Disk.
Skip this step in any of the following scenarios:
- Scenario 1: You have purchased an ECS and a data disk that meet the requirements by referring to (Optional) Step 1: Buy an ECS and the disk has been attached to the ECS.
- Scenario 2: You already have an ECS that meets the requirements (not purchased by referring to (Optional) Step 1: Buy an ECS), and a data disk that meets the requirements and is purchased by referring to (Optional) Step 2: Buy a Data Disk. The data disk has been attached to the ECS during the purchase.
- Create a non-administrator IAM user.
IAM authentication is used for tenant log collection. So you need to create an IAM user (machine-machine account) with the minimum permission to access SecMaster APIs. MFA must be disabled for the IAM user. This account is used by the tenant-side log collector to log in to and access SecMaster. For details, see Creating a Non-Administrator IAM Account.
- Before collecting data, you need to establish the network connection between the tenant VPC and SecMaster. For details, see Step 5: Configure Network Connection.
- Install the component controller (isap-agent) and manage log collector nodes (ECSs) to SecMaster. For details, see Installing the Component Controller (isap-agent).
- Install the log collection component (Logstash) and configure the log collection process. For details, see Installing the Log Collection Component (Logstash).
- Create a log storage location (pipeline) in SecMaster for log storage and analysis. (Optional) Add a data space for importing data. If a third-party data storage space is available, you do not need to add a data space. (Optional) Add a storage pipeline in the new data space for importing data. If a storage pipeline is available, you do not need to add a storage pipeline.
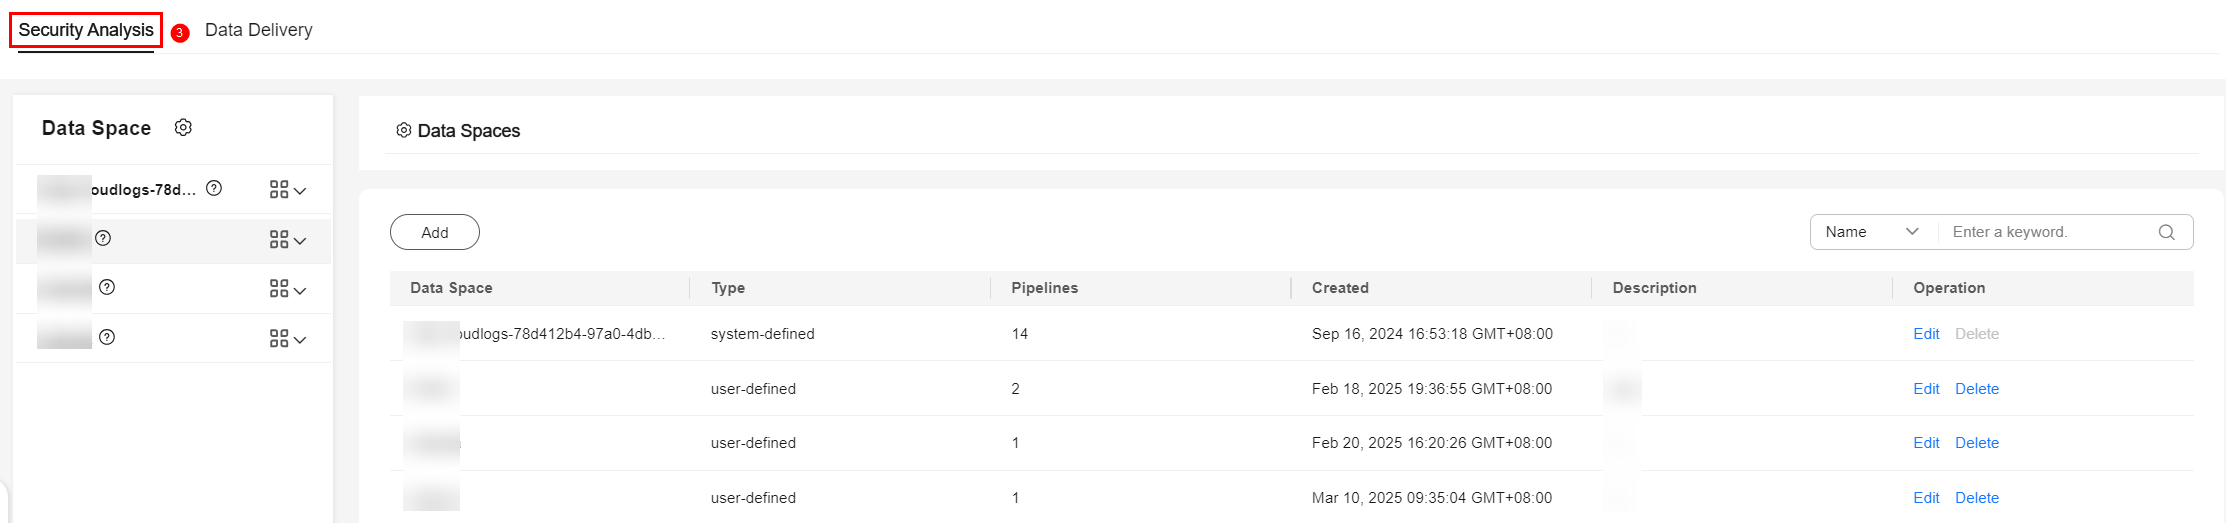
- Go to the target workspace. In the navigation pane on the left, choose . Figure 2 Accessing the Security Analysis tab
- Add a data space.
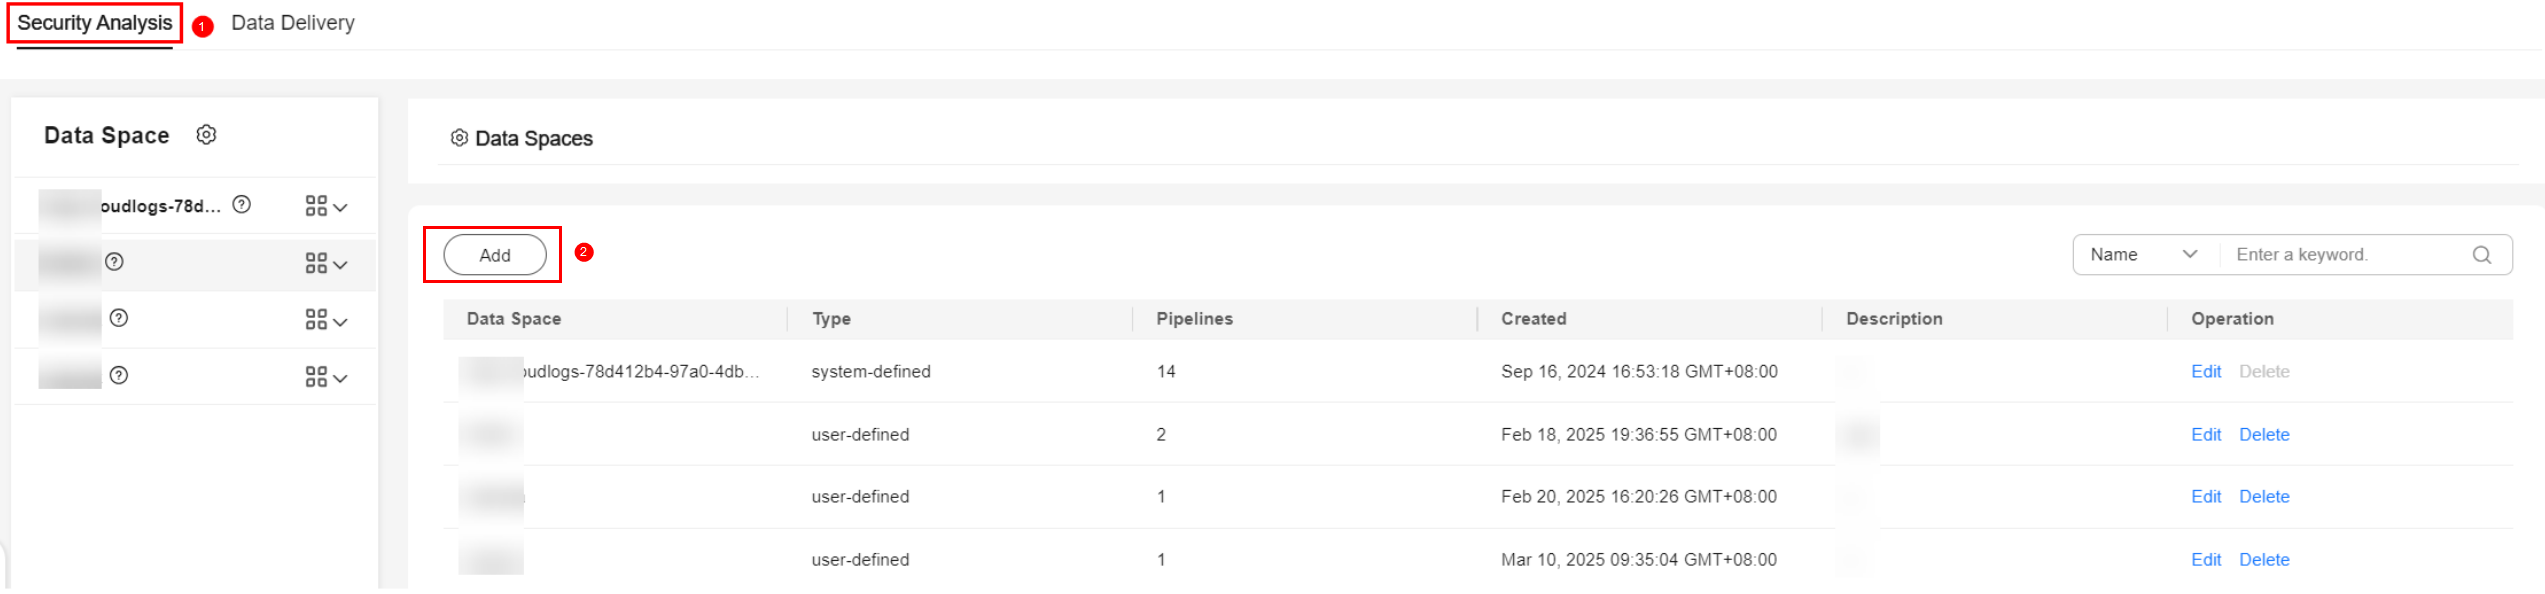
- In the upper left corner of the data space list, click Add. The Add Data Space panel is displayed on the right. Figure 3 Add Data Space
- On the Add Data Space panel, set the parameters for the new data space.
Table 2 Add Data Space Parameter
Description
Data Space
Enter a data space name. Naming rules:
- The name can contain 5 to 63 characters.
- Only letters, numbers, and hyphens (-) are allowed. The name cannot start or end with a hyphen (-) or contain consecutive hyphens (-).
- The name cannot be the same as any other data space name on Huawei Cloud.
Example: DataTransfer
Description
(Optional) Remarks of the data space.
- Click OK.
- In the upper left corner of the data space list, click Add. The Add Data Space panel is displayed on the right.
- In the data space navigation tree on the left, locate the data space added in 8.b, click
 on the right of the data space name, and select Create Pipeline from the drop-down list. Figure 4 Creating a pipeline
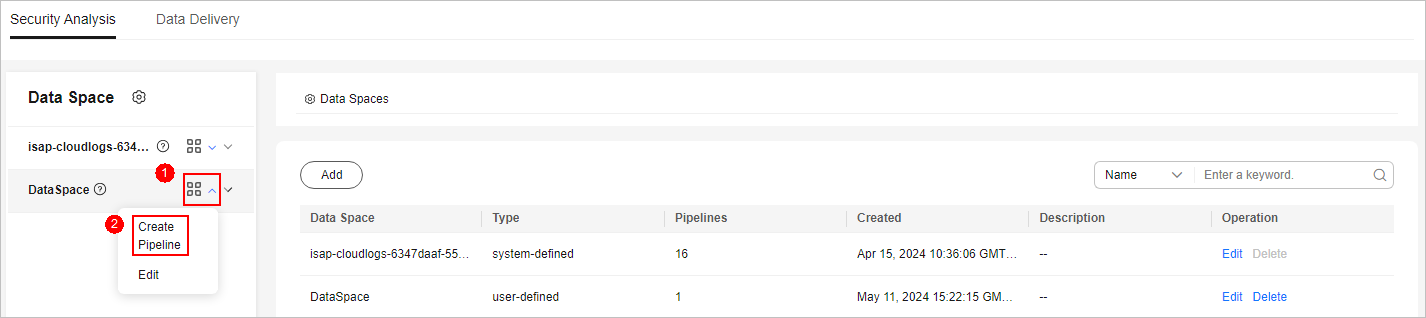
- On the Create Pipeline page, configure pipeline parameters. For details about the parameters, see Table 3.
Table 3 Creating a pipeline Parameter
Description
Data Space
Data space to which the pipeline belongs, which is generated by the system by default.
Pipeline Name
Name of the pipeline. Naming rules:
- The name can contain 5 to 63 characters.
- Only letters, numbers, and hyphens (-) are allowed. The name cannot start or end with a hyphen (-) or contain consecutive hyphens (-).
- The name must be unique in the data space.
You are advised to name the pipeline windows_config_log.
Shards
The number of shards of the pipeline. Value range: 1 to 64. Retain the default value.
Lifecycle
Lifecycle of data in the pipeline. Value range: 7 to 180
Retain the default value.
Description
A brief description of the pipeline. This parameter is optional.
- Click OK. After the pipeline is created, you can click the data space name to check the created pipeline.

You are advised to use different pipelines to store data from different sources so that you can query and analyze the data.
- Go to the target workspace. In the navigation pane on the left, choose .
- Configure the connector. You need to configure log source and log destination parameters.
- Go to the workspace management page. In the navigation pane on the left, choose . Figure 5 Accessing the Connections page
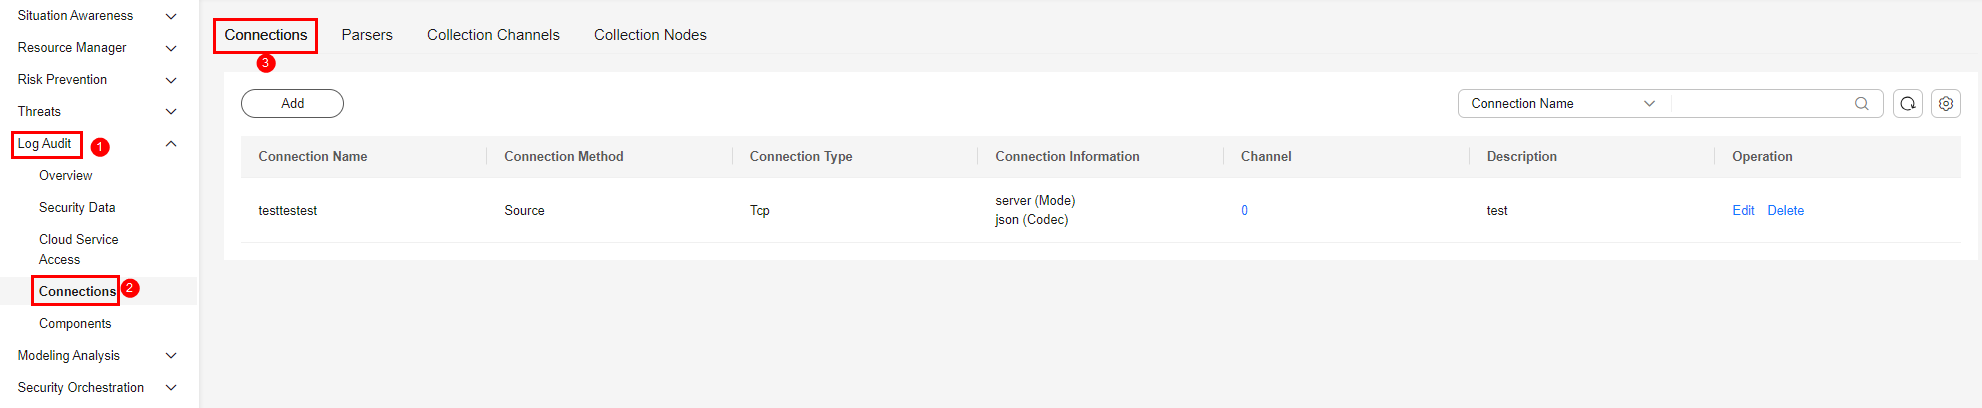
- Add a source for the data connection.
- On the Connections tab, click Add.
- Configure the data connection source details.
The following uses UDP as an example to describe how to add a log data source. For details about other connection types, see Connector Rules.
Table 4 Log source settings Parameter
Description
Connection Method
Select Source.
Connection Type
Select UDP.
Connection Name
Name of the data connection source. In this example, in-windows-config is used.
Description
Enter a brief description of the data source. In this example, Windows configuration log is used.
Port
Set the port for the data connection. In this example, 5157 is used.
Codec
Set the encoding format. You are advised to set it to Plain.
Advanced Settings
No configuration is required.
- After the setting is complete, click Confirm in the lower right corner of the page.
- Add a destination for the data connection.
- On the Connections tab, click Add.
- Configure the data connection destination details.
Table 5 Log transfer destination Parameter
Description
Connection Method
Select Destination.
Connection Type
Select SecMaster.
Connection Name
Enter a custom name for the data connection destination. In this example, out-pipe-windows-config is used.
Description
Enter a custom description of the log data destination. In this example, Windows configuration log is used.
Type
User-defined log destination type. Select Tenant.
Pipe
Select the pipe created in 8. In this example, windows_config_log is used.
Domain_name
Enter the domain account information of the IAM user used to log in to the console.
User_name
Enter the information of the IAM user used to log in to the console.
User_password
Enter the password of the current login IAM user.
Advanced Settings
No configuration is required.
- After the setting is complete, click Confirm in the lower right corner of the page.
- Go to the workspace management page. In the navigation pane on the left, choose .
- Configure log collection channels, connect each functional component, and ensure that SecMaster and log collectors work properly.
- Go to the workspace management page. In the navigation pane, choose . On the displayed page, click the Collection Channels tab. Figure 6 Accessing the Collection Channels tab
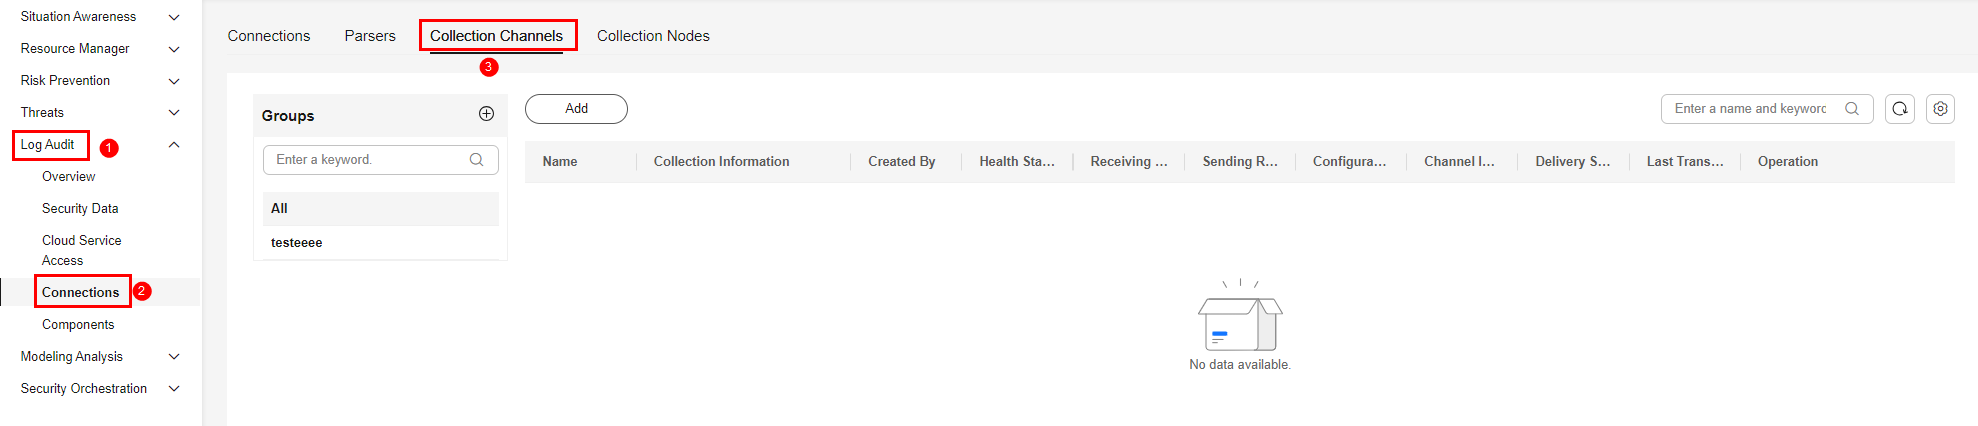
- Add a log collection channel group.
- On the Collection Channels tab, click
 on the right of Groups.
 - Enter a group name, for example, Windows configuration log, and click
 .
.
- On the Collection Channels tab, click
- Create a log collection channel.
- On the right of the group list, click Add.
- In the Configure Basic Information step, configure basic information.
Table 6 Basic information parameters Parameter
Description
Basic Information
Name
Enter a custom collection channel name. In this example, Windows configuration log is used.
Channel Group
Select the group created in 10.b. In this example, Windows configuration log is used.
(Optional) Description
Enter the description of the collection channel.
Source Configuration
Source Name
Select the log source name added in 9. In this example, select in-windows-config.
After you select a source, the system automatically generates the information about the selected source.
Destination Configuration
Destination Name
Select the log destination name added in 9. In this example, select out-pipe-windows-config.
After you select a destination, the system automatically generates the information about the selected destination.
- Click Next in the lower right corner of the page.
- On the Configure Parser page, select Quick access Parser and add raw logs to the collection channel list. After the parser is configured, click Next in the lower right corner.
- On the Select Node page, click Create. In the displayed dialog box, select the ECS node managed in 6 and click OK. Figure 7 Selecting a node

- Click Next in the lower right corner of the page.
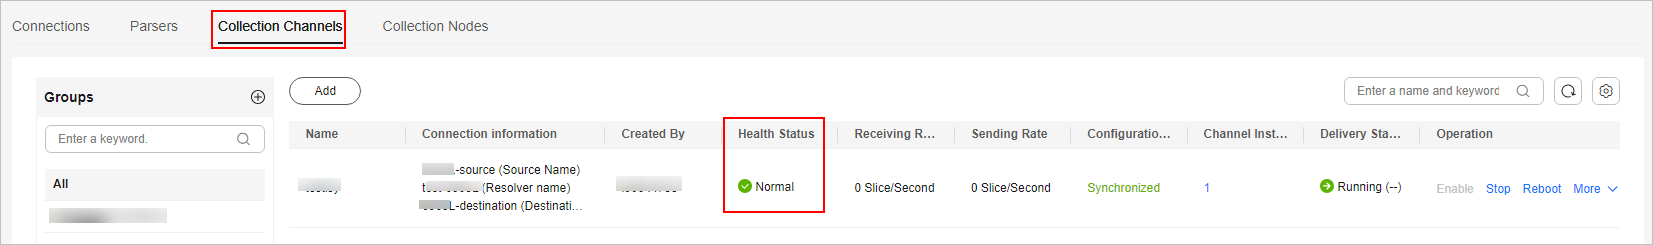
- On the Preview Channel Details page, confirm the configuration and click Save and Execute.
- On the Collection Channels tab, if the health status of a collection channel is Normal, the collection channel is successfully delivered. Figure 8 Collection channels configured
- Modify the configuration file on the ECS backend.
Log in to the ECS node managed in Step 6: Install the Component Controller (isap-agent) as user root and modify the delivered configuration file on the backend.
The configuration file directory is /opt/cloud/logstash/config/files.
Run the grep 5157 *.conf command to query the file to be modified. Modify the input content tcp in the file to beats.
input {
  beats {
    port => 5157
  }
}
Restart the Logstash service.
sh /opt/cloud/logstash/install/appctl.sh restart
- Go to the workspace management page. In the navigation pane, choose . On the displayed page, click the Collection Channels tab.
- Configure Windows log forwarding.
Collect remote logs through the Filebeat service.
- Remotely log in to the target ECS.
- Download the installation package based on your Windows image version.
- Download the Filebeat service from the Filebeat website.
- Decompress the downloaded package and run the install-service-filebeat script.
- Modify the filebeat.yml file.
- Log collection configurations:
filebeat.inputs:
- type: winlog ## Set the input type to winlog, which is used to collect Windows incident logs.
  enabled: true
  name: System ## "System" indicates system incidents, "Security" indicates security incidents, and "Application" indicates application incidents.
  encoding: utf-8
- Log forwarding configurations:
The SecMaster collection node uses the Logstash service to collect logs. You need to modify the following configurations:
- Delete the comment tag (#) from the following two lines of parameters.
#output.logstash:
   #hosts: ["localhost:5044"]
- Change localhost to the IP address of the VM for log collection management. To check the IP address of the data collection ECS node, go to the target workspace, choose in the navigation pane, and click the Nodes tab. On the displayed tab, locate the ECS node and check its IP address.
- Port 5157 is used as an example. If different types of logs need to be collected to SecMaster at the same time, use different ports for different types of logs. The port number ranges from 1025 to 65535. Figure 9 Before the change
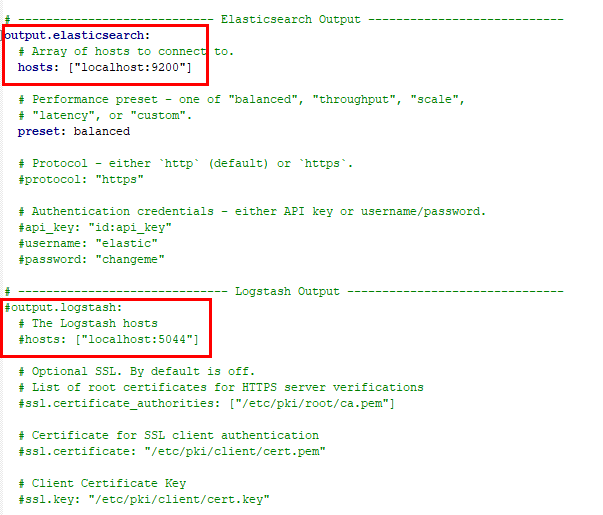
The following figure shows the modification result.
Figure 10 After the change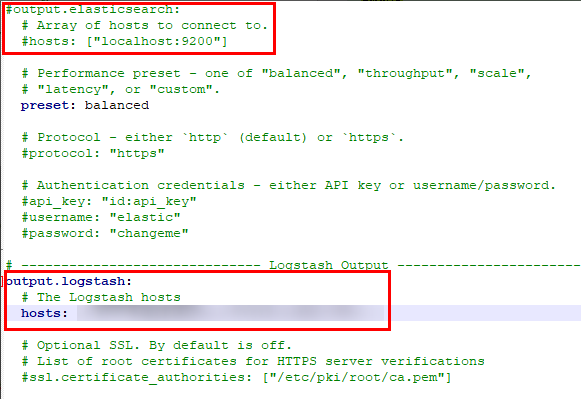
- Delete the comment tag (#) from the following two lines of parameters.
- Start the Filebeat service on the frontend.
- Enter cmd in the search box of the Windows operating system to open the command prompt.
- Enter the following command to go to the drive where the Filebeat installation directory is located. The following uses drive D as an example.
D:
- Enter the following command to go to the Filebeat installation directory.
cd Filebeat-installation-directory
Figure 11 Go to the Filebeat installation directory.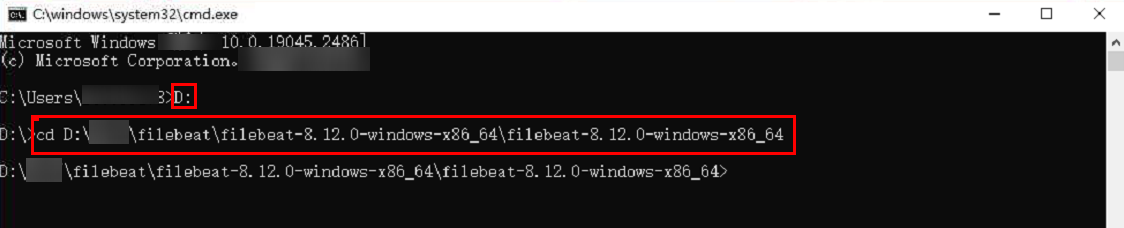
- Enter the following command and press Enter.
(Frontend).\filebeat -e -c filebeat.yml
- After the installation, start the service on the backend.
In the Filebeat directory, right-click the install-service-filebeat PowerShell script file and choose PowerShell from the shortcut menu to open the file. Run the file to start the service on the backend.
- Log collection configurations:
- After logs are integrated into the SecMaster pipeline, query logs on SecMaster.
- Go to the target workspace. In the navigation pane on the left, choose . Select the pipeline (windows_config_log in this example) created or used in 8 to view the data after log parsing.
- For details about how to query and analyze logs, see Querying and Analyzing Logs.
Feedback
Was this page helpful?
Provide feedbackThank you very much for your feedback. We will continue working to improve the documentation.See the reply and handling status in My Cloud VOC.
For any further questions, feel free to contact us through the chatbot.
Chatbot


