Overview
Model Design Method Overview
A data model can reflect the relationships between objects. It incorporates the key information features extracted based on business requirements. It visually represents how the internal information of an enterprise is organized. A data model must be capable of simulating scenarios, easy-to-understand, and easily implemented in the IT system.
DataArts Architecture provides the following modeling methods:
- ER modeling
ER modeling describes the business processes within an enterprise. Compliant with the third normal form (3NF), ER modeling is designed for data integration. It is used for combining and merging data with similarities by subject. ER modeling results cannot be used directly for decision-making, but they are a useful tool.
During ER modeling, you can design physical models in data warehouse planning.
- Physical model: An advanced version of the logic model and used to design the database architecture for data storage with a full consideration of various technical factors. For example, the selected data warehouse is DWS or MRS_Hive.
- Dimensional modeling
Dimensional modeling is the construction of models based on analysis and decision-making requirements. It is mainly used for data analysis. Dimensional modeling is focused on how to quickly analyze user requirements and respond rapidly to complicated, large-scale queries.
A multidimensional model is a fact table consisting of numeric metrics. The fact table is associated with a group of dimensional tables containing description attributes with primary or foreign keys. Typical dimensional models include star models and snowflake models used in some special scenarios.
- Data mart
A data mart (DM) aggregates data from multiple layers and consists of a specific analysis object and its related metrics. The DM provides all statistical data by subject.
In the DataArts Architecture module of DataArts Studio, dimensional modeling involves abstracting facts and dimensions for model creation, and abstracting and sorting out report requirements for constructing metric systems and creating summary models using the data mart.
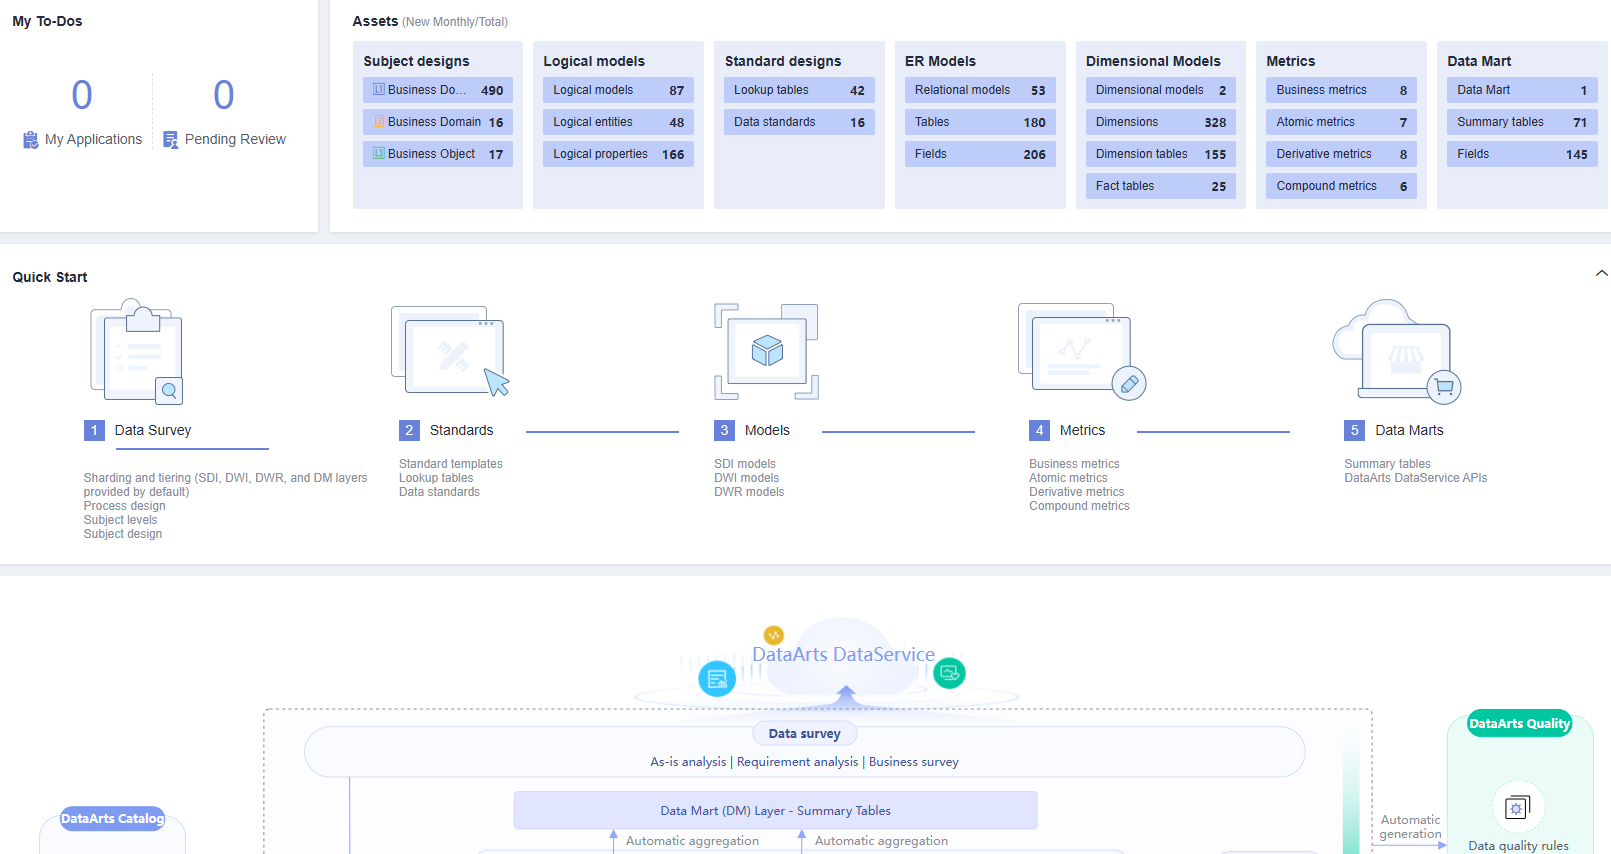
DataArts Architecture Overview Page
On the DataArts Studio console, locate a workspace and click DataArts Architecture. The Overview page is displayed.

- My To-Dos
- The My To-Dos area displays the quantity of My Applications and Pending Review.
- Click the numbers above My Applications and Pending Review to access the My Applications and Pending Review pages, respectively.
- Assets
- The Assets area displays all the objects in DataArts Architecture.
- Click the number next to each object name to access the object management page.
- Quick Start
The Quick Start area displays the overall process for data governance. You can click a specific operation under the process to go to the corresponding page.
- DataArts Architecture Process
- This area displays the DataArts Architecture process and how the DataArts Architecture module interacts with other modules of DataArts Studio. For details about the DataArts Architecture process, see DataArts Architecture Use Process.
- You can move the cursor over the name of an object to view its description.
- You can click the name of any object supported by DataArts Studio to access the object management page.
Information Architecture of DataArts Architecture
An information architecture is a set of component specifications that describe various types of information required for business operations and management decision-making as well as the relationships of business entities. On the Information Architecture page, you can view and manage all tables, including logical entities, physical tables, dimension tables, fact tables, and summary tables.
On the DataArts Studio console, locate a workspace and click DataArts Architecture. In the navigation pane, choose Information Architecture.
- Search
On the top of the Information Architecture page, click Advanced Search, set the table name, type, data source, and other filters, and click Search to search for a specific table. Then click the table name to access its details page.
- Create
Click Create to create logical entities, physical tables, dimensions, fact tables, and summary tables. For details, see Logical Models, ER Modeling, Creating Dimensions, Creating Fact Tables, or Data Mart.
- Synchronize
Choose to synchronize tables to DataArts Catalog as technical assets or synchronize logical models to DataArts Catalog as logical assets. In enterprise mode, you can choose to synchronize the table to the production or development environment. By default, they are synchronized to the production environment.
- Modify Subject
Choose to change the selected table to another subject.
- Delete
Choose to delete a data table. A data table in publishing review, published, or suspension review state cannot be deleted. A referenced data table cannot be deleted either.
- Suspend
Choose to suspend a published data table. A referenced data table cannot be suspended.

Edited versions refer to the data that is re-edited after the publishing review.
- Publish
Click Publish to publish a data table. Data tables in publishing review, suspension review, or published (without edited versions) state cannot be published. In enterprise mode, you can choose to publish the table to the production or development environment. By default, they are synchronized to the production environment.
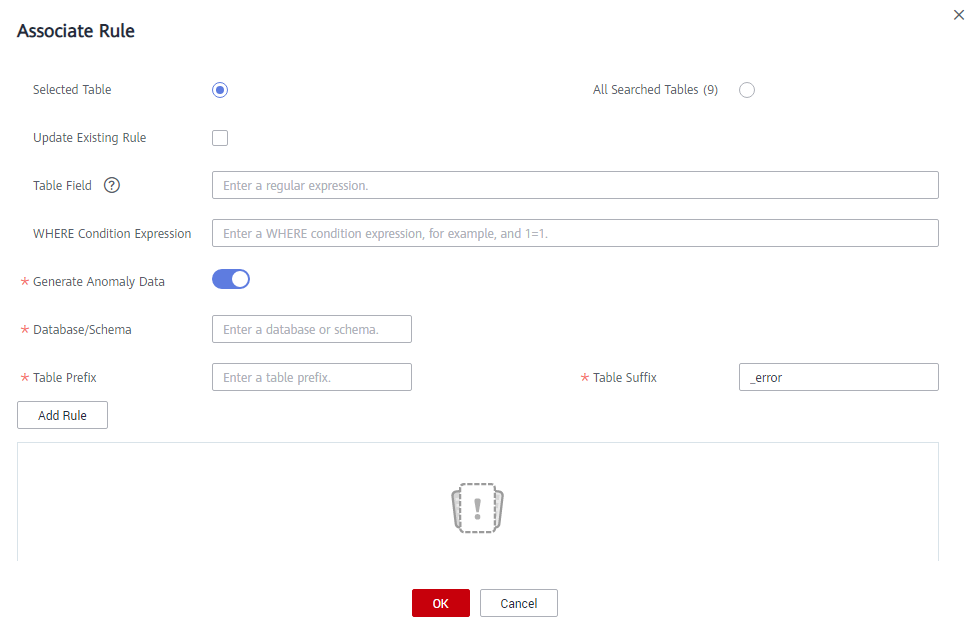
- Associate Rule
Click Associate Rule and set the parameters to associate a quality rule with the object you select. For details, see Associating Quality Rules.
Figure 2 Associating a quality rule with an object
Generate Anomaly Data: If this function is enabled, anomaly data is stored in the specified database based on the configured parameters.
Feedback
Was this page helpful?
Provide feedbackThank you very much for your feedback. We will continue working to improve the documentation.


