Data Mart
A data mart is also called a DM model. It refers to a summary table. A summary table consists of specific analysis objects (such as members) and related statistical metrics. The metrics included in a summary table all have the same level of granularity (such as members). A summary table provides users with all of the available statistics on themed data (such as a member theme market), sorted by levels of granularity.
A summary table can be manually or automatically aggregated. This topic describes how to manually create a summary table.

On the DataArts Architecture page, choose in the left navigation pane, and click the Functions tab. On the page displayed, if Create data development jobs is selected for Model Design Process, the system creates a data development job with a name starting with Database name_Table code. Choose to view the created job. By default, this job has no scheduling configuration. You need to configure scheduling for the job in the DataArts Factory module.
Prerequisites
A dimension, a dimension table, a fact table, and a derivative metric have been created, published, and reviewed.
Creating and Publishing a Summary Table
- On the DataArts Studio console, locate a workspace and click DataArts Architecture.
- In the left navigation pane, choose Models > Data Mart.
- Select a subject in the subject directory on the left and click Create.
- On the Create Summary Table page, perform the following operations:
- Set the parameters in the Basic Settings area.
Figure 1 Basic Settings area
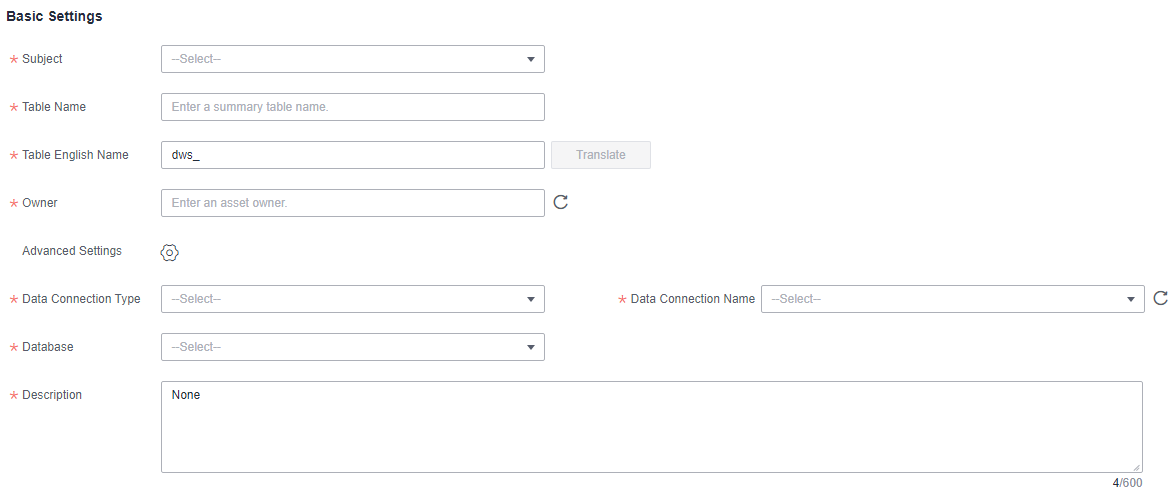
Table 1 Parameters in the Basic Settings area Parameter
Description
*Subject
Select a subject catalog (business domain group > business domain > business object) where you can place the summary table.
*Table Name
The name of the table to create. Newline characters and the following characters are not allowed: \ < > % " ' ;
*Table Code
The code of the table to create. It can contain only letters, digits, and underscores (_), and must start with dws_.
The system can automatically generate the table code through translation based on a configured naming dictionary.
*Owner
You can enter an owner name or select an existing owner.
Advanced Settings
Set custom items to describe the table. The custom items can be viewed in the table details.
For example, if you want to identify the source of the table, you can add item source and set its value to the table source information. Then you can view the table source information in the table details.
*Data Connection Type
The parameter value must be the same as that of the dimension table and fact table.
*Data Connection Name
It is recommended that the same data connection be used for data mart.
*Database
The name of the database. Select a database from the drop-down list box.
Queue
DLI queue. This parameter is available only for DLI data connections.
Schema
DWS or POSTGRESQL mode. This parameter is displayed only for DWS and POSTGRESQL data connections.
Table Type
DLI models support the following table types:- MANAGED: Data is stored in a DLI table.
- EXTERNAL: Data is stored in an OBS table. When Table Type is set to EXTERNAL, you must set OBS Path. The OBS path format is /bucket_name/filepath.
DWS models support the following table types:
- DWS_ROW: row-store table. Tables are stored to disk partitions by row.
- DWS_COLUMN: column-store table. Tables are stored to disk partitions by column.
- DWS_VIEW: view-store table. Tables are stored to disk partitions by view.
The MRS Hive model supports HIVE_TABLE and HIVE_EXTERNAL_TABLE.
The MRS Spark model supports HUDI_COW and HUDI_MOR.
The PostgreSQL model supports only POSTGRESQL_TABLE.
The MRS_CLICKHOUSE model supports only CLICKHOUSE_TABLE.
The Oracle model supports only ORACLE_TABLE.
The MySQL model supports only MYSQL_TABLE.
The Doris model supports only DORIS_TABLE.
Compression Level
This parameter is available when the data connection type is DWS.
The following compression levels are available for different table types:
- DWS_ROW: NO and YES
- DWS_COLUMN: NO, LOW, MIDDLE, and HIGH.
- DWS_VIEW: The compression level is not supported.
Distributed By
This parameter is displayed only for DWS data connections. Currently, only REPLICATION and HASH are supported. You can select multiple fields.
- REPLICATION: A full table is stored on each DN. The advantage of this option is that each DN has all the data of a table. During the join operation, data redistribution can be avoided, reducing network overhead. The disadvantage is that each DN retains the complete data of a table, resulting in data redundancy. Generally, this option is recommended for small dimension tables.
- HASH: If you select this option, you must specify a distribution key for the user table. When a record is inserted, the system performs hash computing based on values in the distribute keys and then stores data on the corresponding DN. In a Hash table, I/O resources on each node can be used during data read/write, which improves the read/write speed of a table. Generally, this option is recommended for large dimension tables (a large dimension table contains over 1 million records).
* Description
A description of the summary table to create. It allows 1 to 600 characters.
- Click the Field Settings tab and configure attributes for the summary table.
Click Add to add one or more associated attributes, for example, derivative metrics.
Click Import Field and select From metrics, From dimension attributes, or Import from Data Standard.

If you select From dimension attributes, you must associate fields with metrics or import fields from metrics before associating fields with dimension attributes or importing fields from dimension attributes.
Fuzzy search is supported when From metrics is selected.
Click Audit Data Standard to audit the data standards of the attributes of the summary table. The audit status is
 .
.Click Associate to associate data standards or security levels with multiple attributes.
Click Delete to delete data standards or security levels from multiple attributes.Figure 2 Configuring attributes
Table 2 Parameters on the Field Settings page Parameter
Description
Name
Newline characters and the following characters are not allowed: \ < > % " ' ;
The added dimension tables and their attribute values are automatically displayed for the dimension attribute field. Generally, you do not need to modify them.
Name (EN)
It must start with letters. Only letters, numbers, and underscores (_) are allowed.
Data Type
Data type of the field name
Configuration Type
Configuration type corresponding to the field name, for example, derivative metric.
Associated Object
Associated object corresponding to the configuration type of the field name, for example, the derivative metric name
Primary Key
If this parameter is selected, the field is a primary key.
NOTE:If an MRS Spark connection is used to connect to MRS Hudi data sources, data can be written to the database only if fields have primary keys. Otherwise, table synchronization fails.
Partition
If this parameter is selected, the field is a partition field.
Not Null
Whether the parameter value can be left empty.
Data Standard
If you have created data standards, click
 to select one to associate with the field. If Create Data Quality Jobs is selected for Model Design Process on the Function Settings tab page in Configuration Center and a field is associated with a data standard, a quality job is automatically generated after a table is published. A quality rule is generated for each field associated with the data standard. The quality of the field is monitored based on the data standard. You can access the Quality Job page of DataArts Quality to view the job details.
If no data standard is available, create one. See Creating Data Standards for details.
Security Level
You can click
 to add a security level for the logical entity attribute.
If you cannot find the security level you want, click go to to go to the DataArts Security console and create a security level.
You can disable this function on the Models tab page on the Configuration Center page.
Description
Description
Audit Status
Whether to audit the data standard
Click Audit Data Standard to audit data standards.
Operation
Related operations
- Click the Code Settings tab to view the code generated by the system and format the metric code.
You can click Generate Code to refresh the generated code, click Copy to Metric Code to copy the code to the metric code, and click Format to format the metric code.
- Set the parameters in the Basic Settings area.
- Click Publish. In the displayed dialog box, select a reviewer and click OK to submit a request for publishing the summary table.

In enterprise mode, you can publish the summary table to the production or development environment. By default, it is published to the production environment. If you do not choose an environment, the summary table cannot be published.
If you have been added as a reviewer, you can select Auto-review and click OK. After the request is approved, the status changes to Published.
If you select multiple reviewers, the status changes to Published only after all reviewers have approved the publishing request. If any reviewer rejects the request, the status is Rejected.
- Select a reviewer to approve the summary table.
After the summary table is approved, it is automatically created in the database.
- Go back to the summary table list and locate the table just published. View its synchronization status in the Sync Status column. You can switch between the production environment and development environment to view the synchronization result.
- If the synchronization is successful, the summary table is successfully published and created in the database.
- If the synchronization failed, choose in the row where the summary table is located. On the page displayed, click the History tab to view logs. Troubleshoot the problem based on the logs. After the error is rectified, choose above the summary table list to issue the synchronization command again. If the problem persists, contact technical support personnel.

In enterprise mode, you can synchronize the summary table to the production or development environment. By default, it is synchronized to the production environment. If you do not choose an environment, the summary table cannot be synchronized.
After a summary table is associated with a quality rule and published, you can click Synchronize Subjects from DataArts Architecture as Directories on the Quality Jobs page on the DataArts Quality console. The quality jobs automatically generated in DataArts Architecture will be synchronized to the corresponding directories in DataArts Quality based on the subject structure.
Managing a Summary Table
- On the DataArts Architecture page, choose in the left navigation pane. On the displayed page, click the Summary Tables tab.
Figure 3 Summary Tables page

- Manage your summary tables as required. Refer to the following table for details.
- Edit a summary table.
- Click Edit to the right of the target summary table.
- Edit the summary table as required.
- Click Publish.

In enterprise mode, you can publish the summary table to the production or development environment. By default, it is published to the production environment. If you do not choose an environment, the summary table cannot be published.
- Publish a summary table.
- Click Publish to the right of the target summary table.
- In the Submit for Publication dialog box displayed, select a reviewer from the drop-down list box.

In enterprise mode, you can publish the summary table to the production or development environment. By default, it is published to the production environment. If you do not choose an environment, the summary table cannot be published.
- Click OK.
- View the publish history.
- Previewing an SQL statement.
- Select the target summary table in the list and choose on the right.
- On the page displayed, you can view or copy the SQL statement.
- Suspend a summary table.
- Click More in the Operation column and select Suspend to the right of the target summary table.
- In the Submit for Suspension dialog box displayed, select a reviewer from the drop-down list box.
- Click OK.

After a summary table is suspended, you can determine how to process APIs based on the actual situation in DataArts DataService. DataArts Architecture does not process the APIs.
- Associate a summary table with a quality rule.
- Select the target summary table in the summary table list and click Associate Rule above the list.
- In the Associate Quality Rule dialog box, you can add rules to the fields in the summary table in batches and associate the rules with the fields.
- Click OK.
- Delete a summary table.
- Select the target summary table and choose above the list.
- In the dialog box displayed, click Yes.
- Import
You can import summary tables to the system quickly.
- Above the summary table list, choose More > Import.
Figure 4 Import Summary Table
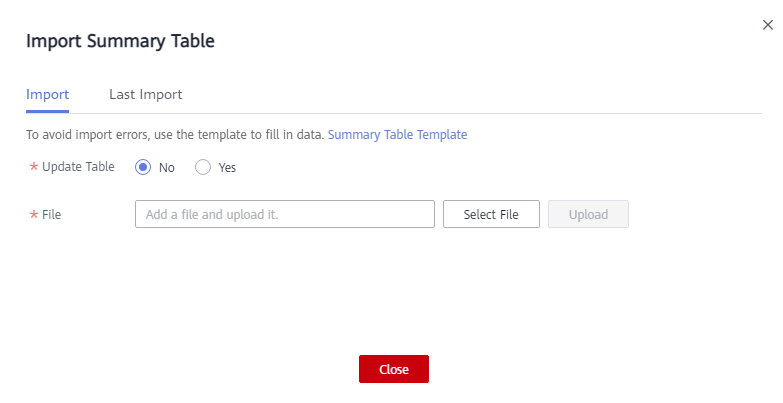
- Download the summary table template, and edit and save it.
- Choose whether to update existing data.

If a table English name in the template already exists in the system, the data is considered duplicate.
- No: If the data to be imported already exists in the system, the existing data in the system will not be replaced.
- Yes: If the data to be imported already exists in the system:
- If the existing data in the system is in draft state, the data will be replaced and new draft data will be generated.
- If the existing data in the system is in published state, expanded data will be generated.
- Click Select File and select the edited template to import.
- Click Upload. When the template is uploaded, the Last Import page is displayed. You can view the imported data.
- Click Close.
- Above the summary table list, choose More > Import.
- Export summary tables.
You can export summary tables to a local file.
- Select the summary tables to export on the Manually Created or Automatically Aggregated page.
- Above the summary table list, choose More > Export.

- You can export all the summary tables of a subject by selecting the subject in the subject list on the left.
- You can export all the summary tables of a workspace, as long as there are no more than 500 summary tables in the workspace.
Associating a Summary Table with a Quality Rule
- On the DataArts Architecture console, choose Models > Data Mart.
- Click the Summary Tables tab.
- Select the target summary table in the list, and click Associate Rule.
Figure 5 Associating a summary table with a quality rule

- On the page displayed, set the parameters. After the configuration is complete, click OK.
- Update Existing Rule: If this option is selected, the newly added rule will overwrite the old rule.
- Table Field: This parameter applies to all fields by default. You can enter a regular expression to filter fields as required.
- WHERE Clause: This parameter can be used to filter fields.
- Generate Anomaly Data: If this option is selected, anomaly data is stored in the specified database based on the configured parameters.
- Database/Schema: database or schema that stores anomaly data. This parameter is displayed when Generate Anomaly Data is enabled.
- Table Prefix: prefix of the table that stores anomaly data. This parameter is displayed when Generate Anomaly Data is enabled.
- Table Suffix: suffix of the table that stores anomaly data. This parameter is displayed when Generate Anomaly Data is enabled.
- Add Rule: You can click Add Rule to add a rule. For example, add a rule named Unique value, select the rule, click OK, enter an alarm condition expression in the Alarm Condition text box, add other rules in the same way, and click OK. An example alarm expression is as follows:

- An alarm condition expression consists of alarm parameters and logical operators. When a quality job is running, the system calculates the result of the alarm condition expression and determines whether to trigger the alarm based on the result of the expression. If the expression result is true, the alarm will be triggered. Otherwise, no quality alarm will be triggered. In the Associate Quality Rule dialog box, the alarm parameters of each quality rule are displayed as buttons.
Figure 6 Associating a summary table with a quality rule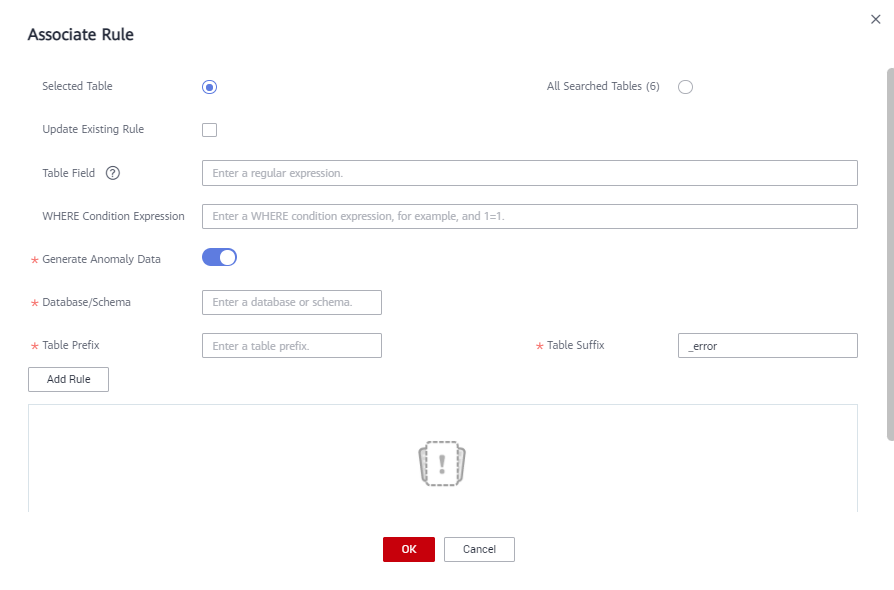
Associating a Summary Table Field with a Data Standard
- On the DataArts Architecture console, choose Models > Data Mart.
- Click the Summary Tables tab.
- Click the name of the target summary table in the list.
- In the table field list on the details page of the summary table, search for the target field, click
 corresponding to the field to configure the association between the field and the data standard.
Figure 7 Associating a summary table field with a data standard
- After the configuration is complete, click OK. For details on the sources of data standards, see Creating a Data Standard.
Figure 8 Associating a data standard

Associating a Single Field with a Quality Rule
- On the DataArts Architecture console, choose Models > Data Mart.
- Click the Summary Tables tab.
- In the summary table list, click the name of the target summary table.
- In the table field list on the summary table details page, locate the target field and click
 to associate the field with a quality rule.
Figure 9 Associating a single table field with a quality rule
- After the configuration is complete, click OK.
- Update Existing Rule: If this option is selected, the newly added rule will overwrite the old rule.
- Add Rule: You can click Add Rule to add a rule. For example, add a rule named Unique value, select the rule, click OK, enter an alarm condition expression in the Alarm Condition text box, add other rules in the same way, and click OK.
- An alarm condition expression consists of alarm parameters and logical operators. When a quality job is running, the system calculates the result of the alarm condition expression and determines whether to trigger the alarm based on the result of the expression. If the expression result is true, the alarm will be triggered. Otherwise, no quality alarm will be triggered. In the Associate Quality Rule dialog box, the alarm parameters of each quality rule are displayed as buttons.
Figure 10 Associating a quality rule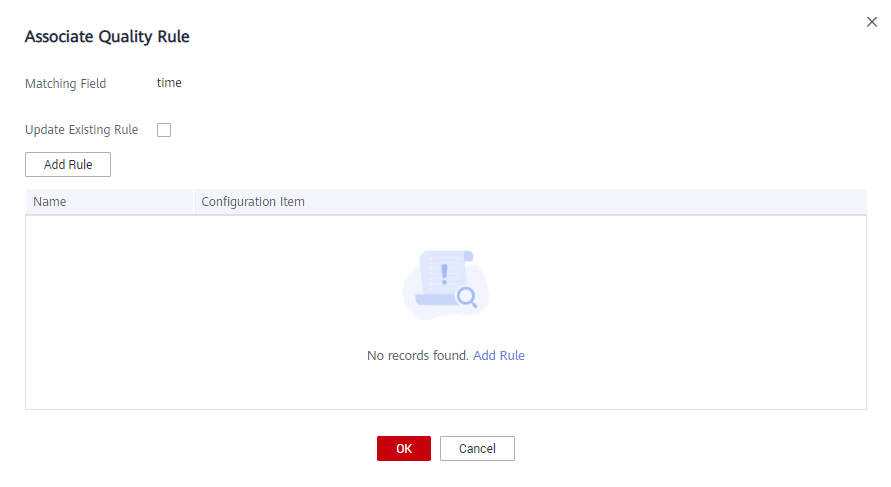
Associating Table Fields with a Quality Rule in Batches
- On the DataArts Architecture console, choose Models > Data Mart.
- Click the Summary Tables tab.
- In the summary table list, click the name of the target summary table.
- In the table field list on the summary table details page, select the target table fields and click Associate Rule.
Figure 11 Associating fields with a quality rule

- On the page displayed, add a rule and set the rule parameters.
- Update Existing Rule: If this option is selected, the newly added rule will overwrite the old rule.
- Add Rule: You can click Add Rule to add a rule. For example, add a rule named Unique value, select the rule, click OK, enter an alarm condition expression in the Alarm Condition text box, add other rules in the same way, and click OK.
- An alarm condition expression consists of alarm parameters and logical operators. When a quality job is running, the system calculates the result of the alarm condition expression and determines whether to trigger the alarm based on the result of the expression. If the expression result is true, the alarm will be triggered. Otherwise, no quality alarm will be triggered. In the Associate Quality Rule dialog box, the alarm parameters of each quality rule are displayed as buttons.
Figure 12 Adding a rule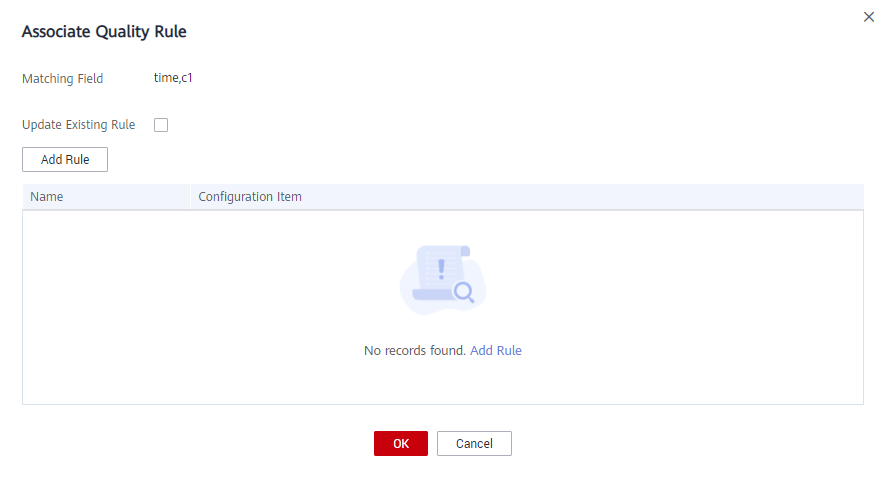
- After the configuration is complete, click OK.
Viewing Summary Table Details
- On the DataArts Architecture console, choose Models > Data Mart in the navigation pane on the left.
- Click the Summary Tables tab.
- Click the name of a summary table to go to its details page.
- View the basic information and fields of the summary table. You can also configure anomaly data output settings.
- Click Modify and enable Generate Anomaly Data. Anomaly data will be stored in the specified database based on the configured parameters.
- Database/Schema: Enter the database or schema that stores anomaly data.
- Set Table Prefix and Table Suffix, which indicate the prefix and suffix of the table that stores anomaly data.

The prefix and suffix of the table can contain only letters, digits, and underscores (_).
- Click
 to save the settings.
- You can configure a where condition expression to filter fields.
Feedback
Was this page helpful?
Provide feedbackThank you very much for your feedback. We will continue working to improve the documentation.


