Enabling Observability for cilium-agent in a Cluster with DataPlane V2 Enabled
In a cluster with DataPlane V2 enabled, the cilium-agent component is deployed on each node. You can enable the observability for this component by referring to this section.
Prerequisites
- CCE DataPlane V2 is released with restrictions. To use this feature, submit a service ticket to CCE.
- Currently, only CCE standard clusters of v1.27.16-r50, v1.28.15-r40, v1.29.15-r0, v1.30.14-r0, v1.31.10-r0, v1.32.6-r0, and later versions that have DataPlane V2 enabled support the observability of the cilium-agent component.
Step 1: Configure a ConfigMap and Rebuild yangtse-cilium
- Connect to your cluster using kubectl. For details, see Accessing a Cluster Using kubectl.
- Create the cilium-config.yaml file and specify the following native ConfigMap configuration of the Cilium community:
apiVersion: v1
data:
  prometheus-serve-addr: :9962
kind: ConfigMap
metadata:
  name: cilium-config
  namespace: kube-system
Table 1 Parameters Parameter
Description
Remarks
prometheus-serve-addr
Address for accessing the metrics of the cilium-agent component.
This parameter is set to :9962 here. The colon cannot be omitted.
- Create the ConfigMap.
kubectl apply -f cilium-config.yaml
- Roll back and rebuild yangtse-cilium to apply the configuration.
uuid=$(uuidgen)
kubectl patch daemonset -nkube-system yangtse-cilium --type='json' -p="[{\"op\": \"add\", \"path\": \"/spec/template/metadata/annotations/change-id\", \"value\": \"$uuid\"}]"
Step 2: Install Add-ons
- Install the Cloud Native Cluster Monitoring add-on. For details, see Cloud Native Cluster Monitoring.
- Install the Grafana add-on. For details, see Grafana.
Step 3: Configure a Cilium Observability Task
- Create the cilium-monitor.yaml file. You can specify the following configuration to create a ServiceMonitor for Cilium observability.
apiVersion: v1 kind: Service metadata: annotations: prometheus.io/port: "9962" prometheus.io/scrape: "true" labels: k8s-app: cilium name: cilium namespace: kube-system spec: clusterIP: None clusterIPs: - None internalTrafficPolicy: Cluster ipFamilies: - IPv4 ipFamilyPolicy: SingleStack ports: - name: metrics port: 9962 protocol: TCP targetPort: prometheus selector: k8s-app: cilium sessionAffinity: None type: ClusterIP --- apiVersion: monitoring.coreos.com/v1 kind: ServiceMonitor metadata: name: cilium namespace: monitoring spec: endpoints: - honorLabels: true path: /metrics port: metrics relabelings: - action: labelmap regex: __meta_kubernetes_service_label_(.+) scheme: http jobLabel: cilium namespaceSelector: matchNames: - kube-system selector: matchLabels: k8s-app: cilium - Create the ServiceMonitor.
kubectl apply -f cilium-monitor.yaml
Step 4: Configure the Cilium Metric Dashboard
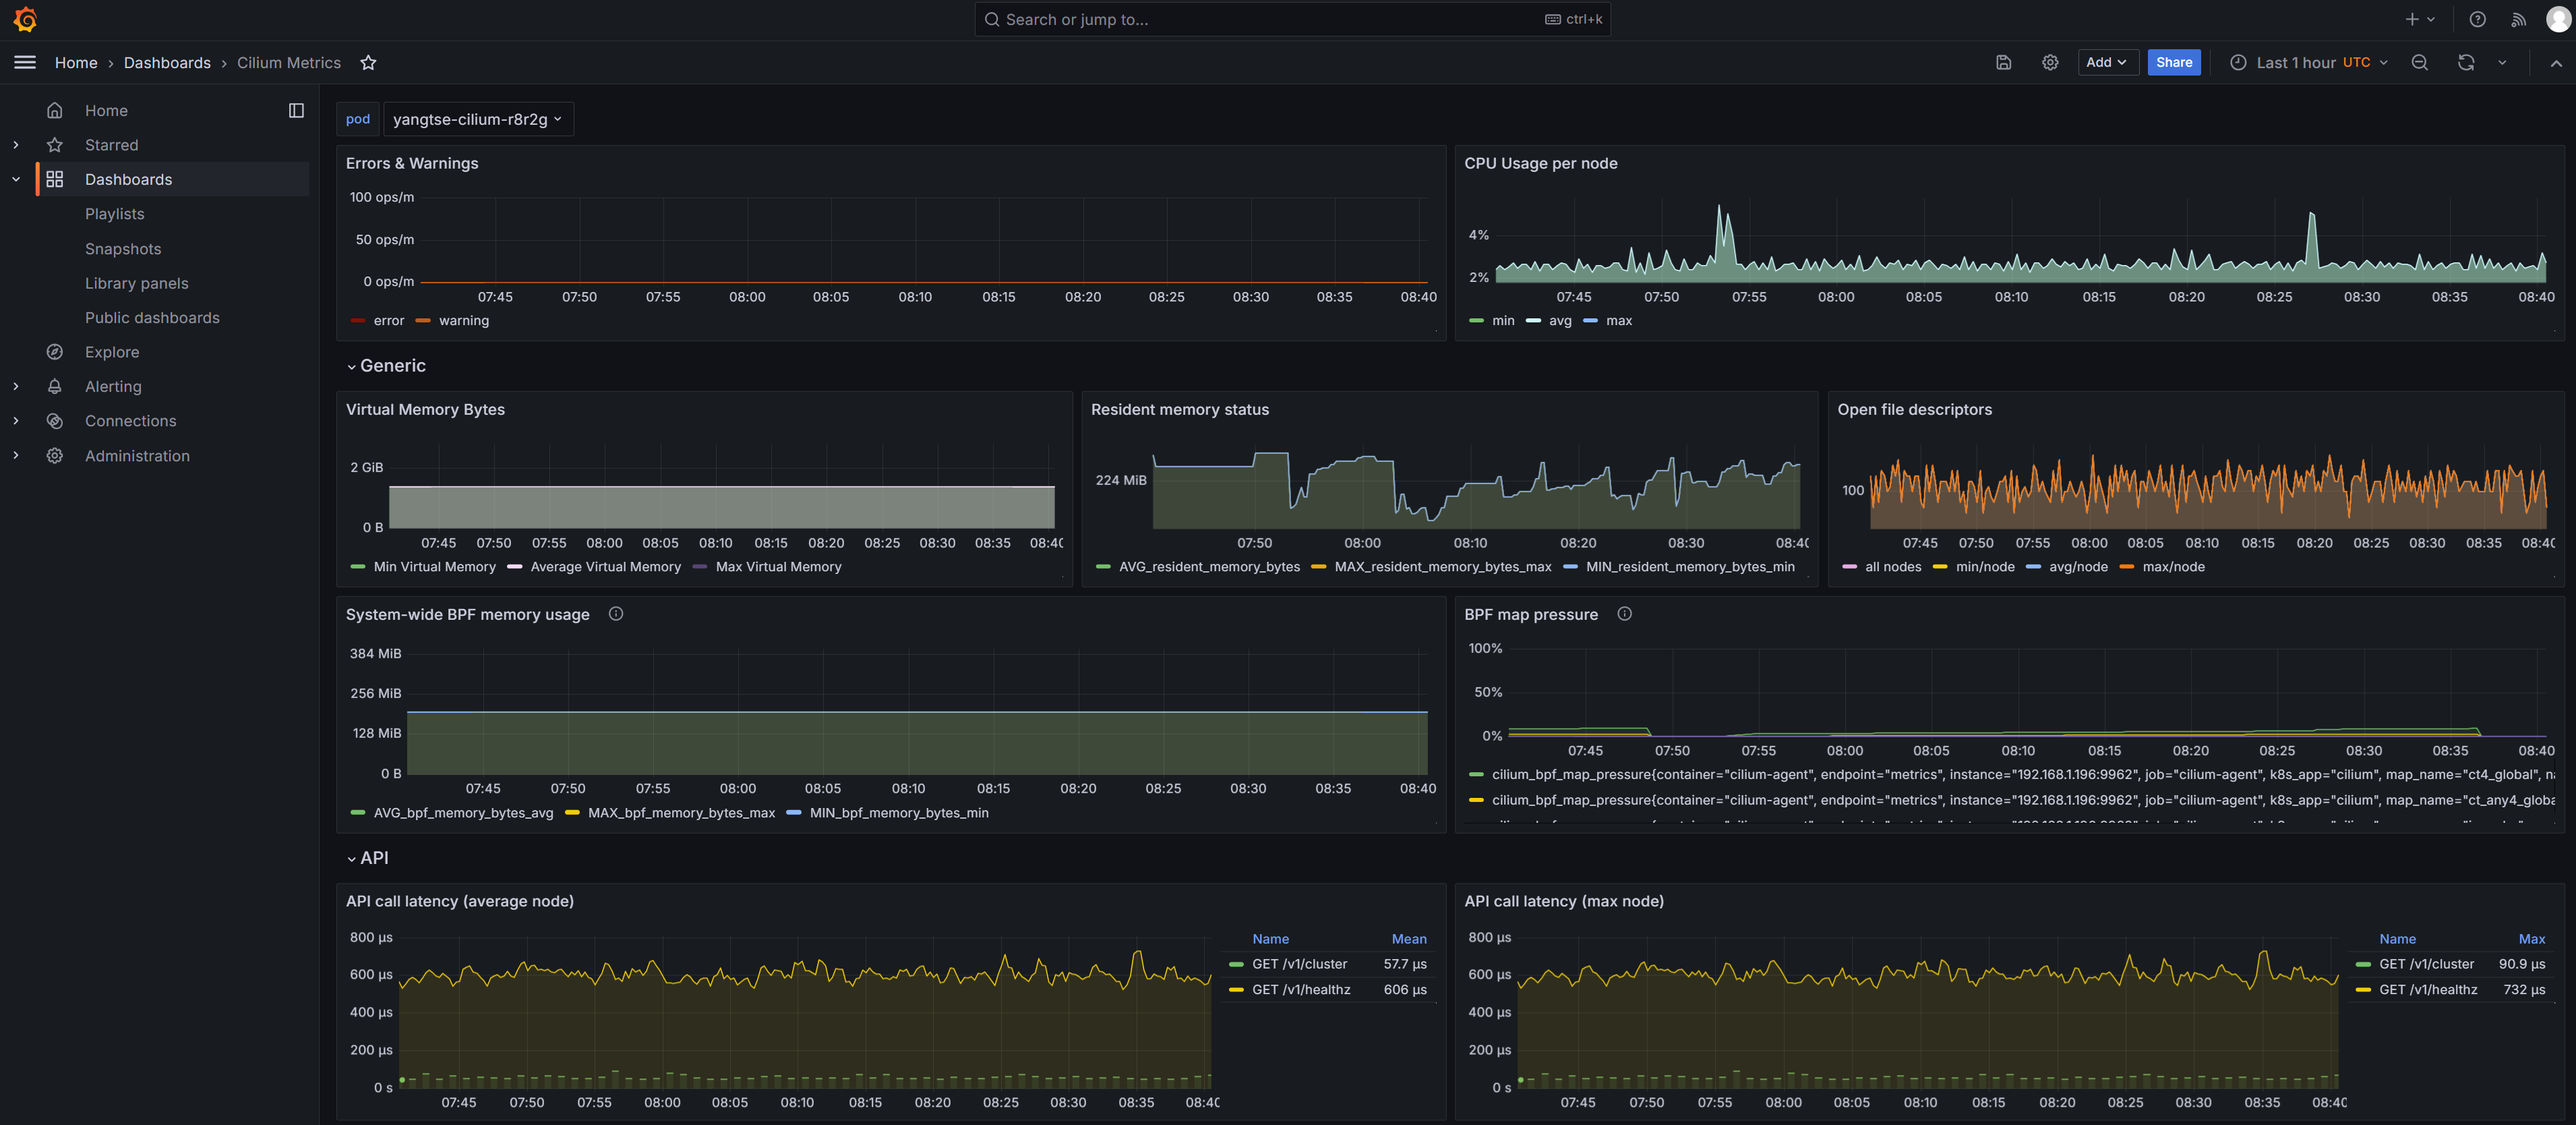
The Cilium official website provides a Grafana dashboard for Cilium metrics. Compared with the monotonous metrics of Prometheus, the Grafana dashboard is more attractive. You can access the dashboard to view Cilium metrics.
- Prepare the configuration file of the Cilium metric dashboard. Open the Prometheus sample file in the Cilium community, locate cilium-dashboard.json in the file, and copy it.
- Log in to Grafana, choose Dashboards, and import the cilium-dashboard.json file.

If you have enabled Interconnect with AOM when installing the Grafana add-on in Step 2: Install Add-ons, change the datasource field in the cilium-dashboard.json file to prometheus-aom, and then import the file.
- Access the dashboard to view Cilium metrics. For details about Cilium metrics, see cilium-metrics.

Feedback
Was this page helpful?
Provide feedbackThank you very much for your feedback. We will continue working to improve the documentation.See the reply and handling status in My Cloud VOC.
For any further questions, feel free to contact us through the chatbot.
Chatbot


