

Troubleshooting Storage Overload
All SQL operations in this section need to be performed using the root user.
Scenarios
A production database should maintain sufficient storage headroom. When storage usage becomes excessively high, it must be handled promptly to prevent issues such as storage exhaustion and potential database corruption.
Storage Metrics
You need to pay attention to the following key metrics:
- Storage usage: rds039_disk_util
- Total storage: rds047_disk_total_size
- Used storage: rds048_disk_used_size
- Transaction logs (WAL logs) usage: rds040_transaction_logs_usage
- Oldest replication slot lag (WAL logs accumulated due to replication slot problems): rds045_oldest_replication_slot_lag
Possible Causes
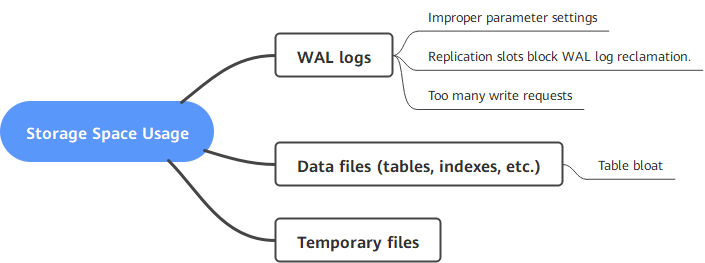
In an RDS for PostgreSQL instance, data files (such as tables and indexes), WAL logs, and temporary files may occupy the most storage space. If the storage usage increases unexpectedly, analyze the causes as follows:
Impact on Workloads
- Storage exhaustion causes the instance to enter read-only mode. Applications cannot write data to the RDS database, affecting workloads.
- Disk I/O overload slows down database responses and increases query and write latency. In severe cases, it may cause connection timeouts and request backlog, affecting workloads.
Handling Suggestions
The following recommendations are provided for full storage issues:
- Data lifecycle management
- Periodic archiving and cleanup: Develop a policy to periodically archive cold data (for example, to OBS) and delete it from the production database.
- Partitioning: Partition large data tables by time (such as daily or monthly) and periodically run DROP PARTITION to delete historical data.
- SQL and table structure optimization
- Avoid large temporary files: Optimize SQL statements and add indexes to sorting and grouping fields.
- Review large field usage: Choose the minimal data type necessary for each table column. Preferentially choose numeric types, then date or binary types, and reserve character types as the final choice. Larger column data types require more space for indexes.
- Local WAL log growth
Monitor primary/standby replication status: Handle replication lag and node exceptions promptly. If a node is abnormal, submit a service ticket.
- Alarm configurations and preventive policies
- Configure alarms: Configure storage usage alarm thresholds (for example, 80% for major alarms and 90% for critical alarms) on Cloud Eye and set alarm rules in advance.
- Monitor storage changes: The storage overview area displays the instance's storage usage, available storage, total storage, daily growth in the last week, and estimated number of available days, providing a quick overview of storage status.
- Configure storage autoscaling: Plan and configure storage autoscaling in advance based on the storage usage growth.
The following recommendations are provided for disk I/O overload issues:
- Configure alarms on Cloud Eye for metrics, such as IOPS, disk read throughput, disk write throughput, disk read time, and disk write time.
- Perform regular slow SQL checks: Check for slow queries and index usage to address potential issues proactively.
- Perform stress testing in test environments in advance: Conduct stress tests on databases in test environments prior to new feature launches or major promotion events to identify I/O bottlenecks.
- Monitor primary/standby replication status: Select primary/standby as the production instance type. Handle replication latency and node anomalies in a timely manner.

SQL statements for querying the storage usage of databases, tables, or WAL logs occupy a large amount of disk I/O. Therefore, run such SQL statements during off-peak hours.
- Check whether the WAL log size is within its allowed range. If no, rectify the fault.
- Check the WAL log size.
View the rds040_transaction_logs_usage metric or run the following SQL statement as root to check the WAL log size. If there are many WAL logs, perform the following steps to locate the fault.
select round(sum(size)/1024/1024/1024,2) "GB" from pg_ls_waldir();
The pg_ls_waldir() function is available only in RDS for PostgreSQL 12 and later versions.
User root is required to execute the pg_ls_waldir function.
- Check the WAL log retention parameter.
- For RDS for PostgreSQL 12 or earlier versions, check the value of wal_keep_segments (unit: MB). For later versions, check the value of wal_keep_size (unit: MB).
- The value of the WAL log retention parameter should be greater than 4 GB but less than 10% of the total storage. If it is too small, the primary instance may clear the WAL logs required by the standby instance, causing exceptions on the standby instance.
- Check the replication slot status and the size of logs that are not cleared.
Replication slots block WAL recycling. If inactive or unnecessary replication slots are found, delete them as required.
Run the following SQL statements as root to query the slot statuses and WAL lag:
select slot_name, active,
pg_size_pretty(pg_wal_lsn_diff(b, a.restart_lsn)) as slot_latency
from pg_replication_slots as a, pg_current_wal_lsn() as b;
Run the following SQL statement as root to delete a slot:
select pg_drop_replication_slot('slot_name'); - Check how busy the write workload is.
View the rds044_transaction_logs_generations metric to determine how busy write services are. This metric indicates the average size of transaction logs (WAL logs) generated per second.
If the value of this metric is large, there are a large number of write services. In this case, the database kernel reserves more WAL logs for recycling, and the storage usage of WAL logs increases. You are advised to scale up storage to ensure storage redundancy.
- Check the WAL log size.
- Check whether the data file size is within the allowed range. If not, correct the issue.
- Run the following SQL statement as root to query the top 10 databases with the highest storage usage:
select datname, pg_database_size(oid)/1024/1024 as dbsize_mb from pg_database order by dbsize_mb desc limit 10;
- View the top 10 objects (tables/indexes) with the highest storage usage.
Run the following SQL statement as root to estimate the size of a table or index based on the relpages field of pg_class:
select relname, relpages*8/1024 as tablesize_mb from pg_class order by tablesize_mb desc limit 10;
To obtain the exact size of a table or index, use any of the following functions:
Table 1 Function description Name
Return Type
Description
pg_relation_size(relation regclass, fork text)
bigint
Storage space used by a specified fork ('main', 'fsm', 'vm', or 'init') of a specified table or index
pg_relation_size(relation regclass)
bigint
Shorthand for pg_relation_size(..., 'main')
pg_table_size(regclass)
bigint
Storage space used by a specified table, excluding indexes (but including TOAST, free space map, and visibility map)
pg_total_relation_size(regclass)
bigint
Total storage space used by the specified table, including all indexes and TOAST data
- Check whether there is any table bloat.
Once the table that occupies a large amount of storage space is determined, you can use the pgstattuple extension to analyze whether the table is bloated. The extension can be installed by running the following SQL statements as root:
select control_extension('create', 'pgstattuple');
select * from pgstattuple('table_name');
Some kernel versions do not support the pgstattuple extension. For details, see Supported Extensions.
For details about how to use this extension, see https://www.postgresql.org/docs/15/pgstattuple.html.
- Clear table data.
- If any table bloat is found, you can vacuum the table in the maintenance time window. Run the SQL statement shown below as root.
VACUUM FULL locks the table. Ensure that no DML operation is being performed during the operation.
vacuum full table_name;
- If any unnecessary table or data is found, you can use the truncate table or drop table statement to delete unnecessary data.
truncate table table_name;
- The DELETE operation does not release storage. Instead, there will be a large number of WAL logs generated, which increase the storage consumption. Do not use DELETE to release storage space when the storage is full.
According to the Multi-Version Concurrency Control (MVCC) mechanism of PostgreSQL, the DELETE operation does not release storage space (deleted data is marked as invisible). The storage space can be released only after VACUUM FULL is executed. The VACUUM FULL operation also consumes storage space and locks the table. Therefore, perform this operation during off-peak hours and reserve at least twice the size of the table.
- If only a small amount of data needs to be retained, you can create a new table and transfer the data to the table. The procedure is as follows:
- Store information such as the structure and indexes of the original table.
- Create a new table.
- Insert data into the new table.
- Check whether the data in the new table meets the expectation. If yes, go to the next step. If no, check whether the previous operations are successful.
- Delete the original table.
- Rename the new table and create indexes.

VACUUM FULL rebuilds the table and its indexes. During this period, WAL logs are generated. Sufficient storage space needs to be reserved. (Assume that the size of the rebuilt table is 1 GB and the size of indexes is 0.5 GB. You are advised to reserve at least 2.5 GB of storage space.)
For details about vacuum, see https://www.postgresql.org/docs/current/routine-vacuuming.html.
- If any table bloat is found, you can vacuum the table in the maintenance time window. Run the SQL statement shown below as root.
- Run the following SQL statement as root to query the top 10 databases with the highest storage usage:
- If the storage usage is greater than or equal to 97%, the instance becomes read-only and data cannot be cleared using DROP or TRUNCATE. To resolve this issue, use either of the following methods:
- Scale up the storage.
For instances with less than 1 TB of storage, if the storage usage drops below 87%, the read-only state is automatically cleared. For instances with 1 TB or more storage, if the remaining space exceeds 150 GB, the read-only state is automatically cleared. After the instance exits the read-only state, you can delete unnecessary data using DROP or TRUNCATE. You can enable storage autoscaling for instances using cloud disks. When the storage usage reaches the threshold, storage autoscaling is triggered.
- If you do not want to scale up the storage, release the instance from read-only state on the console, or run the set default_transaction_read_only = off; command to release it and then run the DROP or TRUNCATE command to delete unnecessary data. Before releasing the instance from read-only mode, stop writing data. If data writes continue after read-only mode is cleared, the storage may become full again, causing instance anomalies.
- Scale up the storage.
- Check whether temporary file size is within the allowed range. If no, rectify the fault.
If high storage usage is not caused by data files or WAL logs, temporary files may occupy a large amount of storage space. Run the following SQL statement as root to check the size of temporary files:
select round(sum(size)/1024/1024/1024,2) "GB" from pg_ls_tmpdir();
- The pg_ls_waldir() function is available only in RDS for PostgreSQL 12 and later versions.
- User root is required to execute the pg_ls_waldir function.
- When there are a large number of temporary files, the SQL statement execution is slow.
Generally, temporary files are released after complex SQL statements are executed. However, if an OOM exception occurs, temporary files may fail to be released. To reduce the generated temporary files, analyze and optimize slow SQL statements. Or you can reboot the instance in the maintenance time window to delete all temporary files.
- Table structure and storage optimization
- Table partitioning: Partition tables by time or workload to facilitate historical data cleanup.
- Data archiving policy
- Migrate historical data to archive tables (regular tables or foreign tables).
- Use materialized views to aggregate historical report data.
- Index optimization
- Periodically rebuild bloated indexes: Use REINDEX or pg_repack to reclaim index space.
- Delete unused indexes.
- Expression index optimization: Avoid using functions on indexed columns.
- Log and bloat cleanup
- Periodically run VACUUM FULL manually during off-peak hours to reclaim space from table bloat.
- Clean up WAL logs: Configure an appropriate WAL retention period to prevent log accumulation.
- Monitoring and alerting system
- Capacity alerts: Configure rules to trigger an alarm when storage usage exceeds 70%, and an alarm when storage usage exceeds 80%. For details, see Setting Alarm Rules.
- Capacity estimation: Calculate the estimated storage growth. If the current available storage capacity is insufficient to support the growth, scale up the storage.
Estimated storage growth = (Daily data growth x Data retention days) x 1.5 (bloat factor) The daily data growth is the average daily growth over the past week in Capacity estimation, and data retention days are based on actual workload requirements.
- Architecture-level optimization
- Elastic expansion: Use storage scale-up. When instance storage reaches the threshold, storage autoscaling is triggered.
References
What is your overall rating for this page?
Thank you very much for your feedback. We will continue working to improve the documentation.See the reply and handling status in My Cloud VOC.
For any further questions, feel free to contact us through the chatbot.
Chatbot


