
Help Center/
Cognitive Engagement Center/
User Guide/
Tenant Administrator Guide/
Making Intelligent Outbound Calls/
Monitoring Outbound Call Tasks
Updated on 2023-10-12 GMT+08:00
Monitoring Outbound Call Tasks
Procedure
- Log in to the AICC as a tenant administrator, choose , and click an outbound call task to access the outbound call task details page.
Figure 1 Outbound call task details page
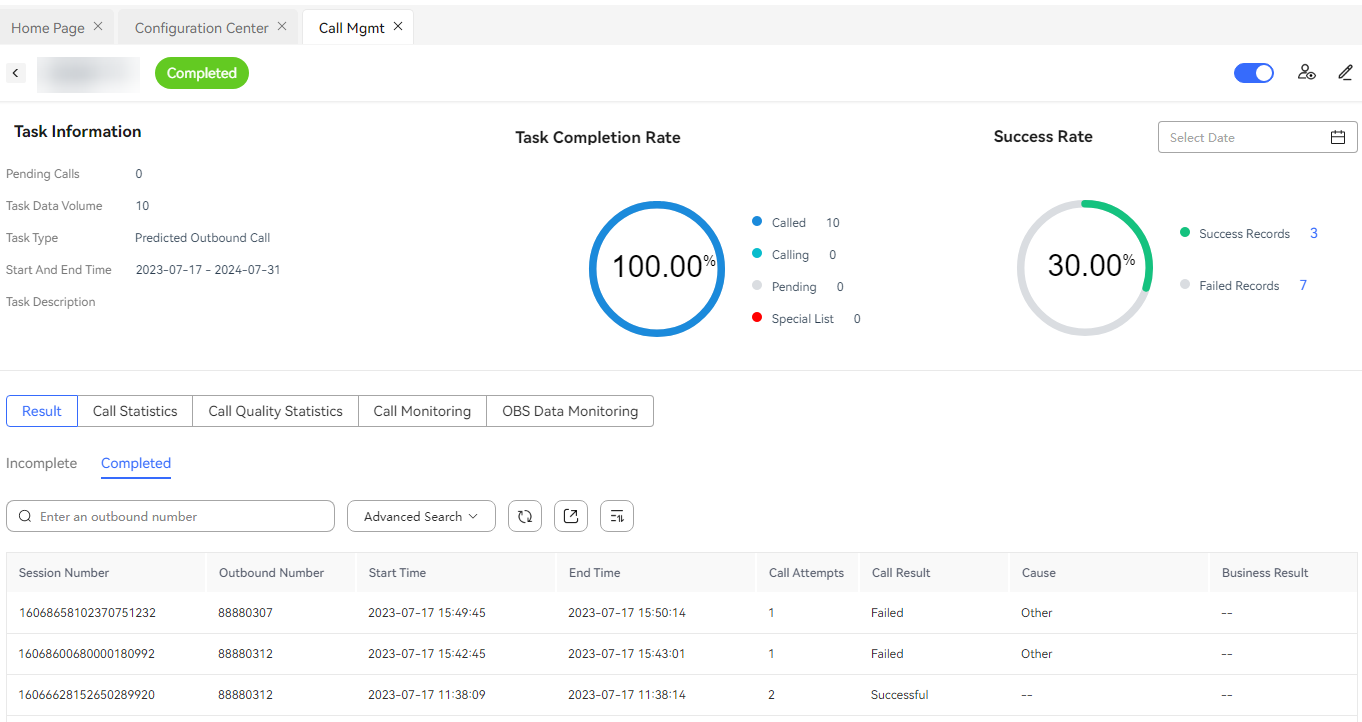
- Task completion rate: View the execution status of the outbound call task, including the number of samples that have been called, the number of samples that are being called, the number of samples that have not been called, the number of special list samples, and the completion rate (number of called samples/total number).
- Success Rate: statistics on successful and failed outbound calls.
- If the number of successful records is not 0 and is clicked, a dialog box is displayed, showing the business result and quantity in a bar chart.
- If the number of failed records is not 0 and is clicked, a dialog box is displayed, showing the external outbound call failure cause and the number of failed calls. For details about external outbound call failure causes, see Defining Outbound Call Results.
- Select Date: daily statistics. By default, this check box is not selected, that is, all the outbound call results in the task are displayed. If you select it, you can specify a statistics date.
- Feedback Rate: collects statistics on the number of valid answered calls and the number of successful calls. Click the drop-down arrow to switch to the feedback rate (available only for intelligent outbound calls).
- Select Date: daily statistics. By default, this check box is not selected, that is, all the feedback statistics in the task are displayed. If you select it, you can specify a statistics date.
- View call statistics. Click Call Statistics in the lower part. (This parameter is available only for predicted, previewed, and preempted outbound calls.)
Figure 2 View call statistics.
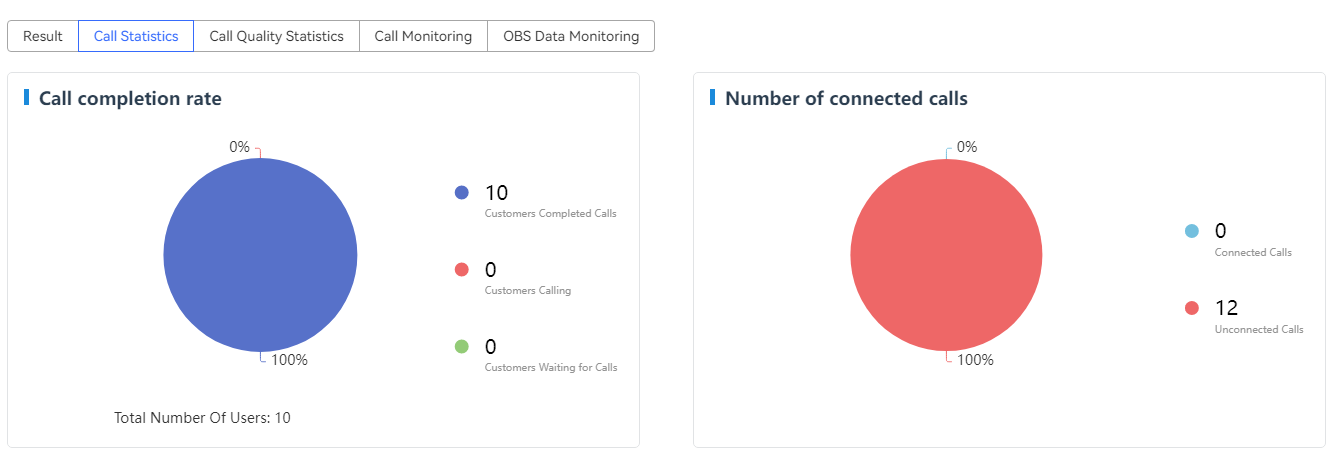
- The outbound call task progress is displayed, including the total number of users (text), call completion rate (pie chart), number of connected users/number of unconnected users (pie chart), contact rate (ring chart), call completion rate (ring chart), and call abandonment rate (ring chart).
- View call quality statistics. Click Call Quality Statistics in the lower part. (This parameter is available only for predicted, previewed, and preempted outbound calls.)
Figure 3 Call Quality Statistics
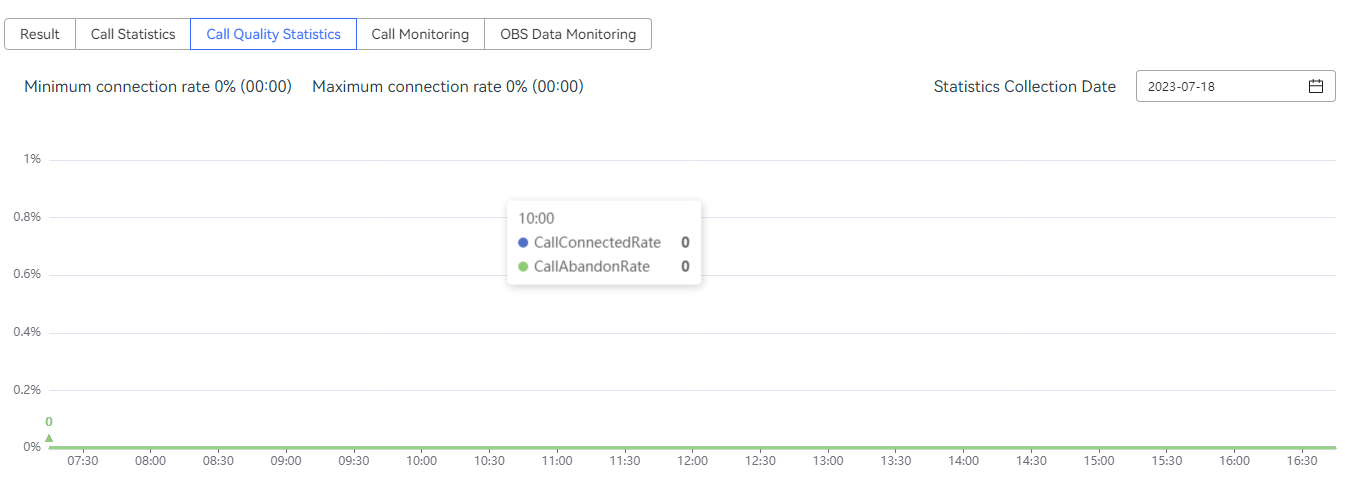
- Displays the user connection rate and user abandonment rate, including the user connection rate and user abandonment rate (line chart). You can select a specific date but cannot select a time earlier than the task start time or later than the current day.
- View call monitoring information. Click Call Monitoring in the lower part. (This parameter is available only for predicted outbound calls.)
Figure 4 Call monitoring
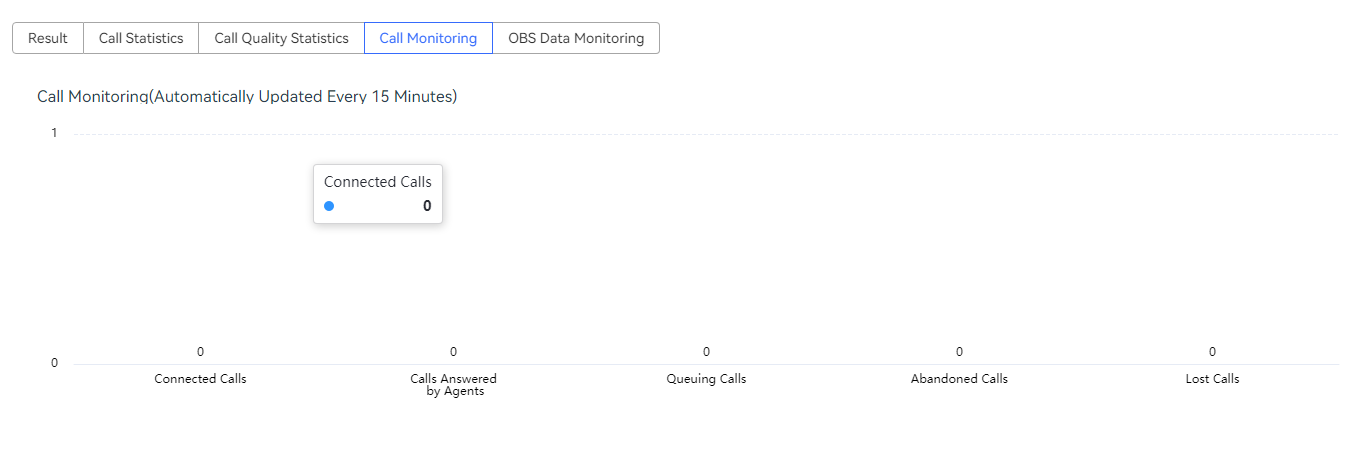
- The monitoring graph of the task is displayed. The monitoring graph is refreshed every 15 minutes and displays the following information in a bar chart: number of connected calls, number of calls answered by agents, number of calls waiting in queues, number of abandoned calls, and number of lost calls.
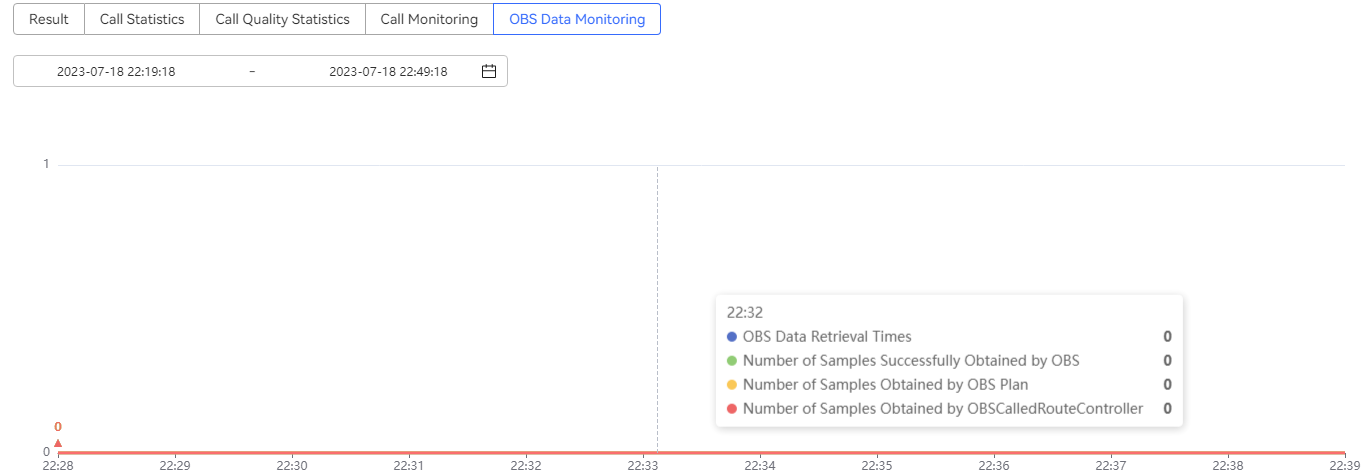
- View the OBS data monitoring. Click OBS Data Monitoring in the lower part. (This page is available only for forecast, preview, and preempted outbound calls.)
Figure 5 OBS Data Monitoring
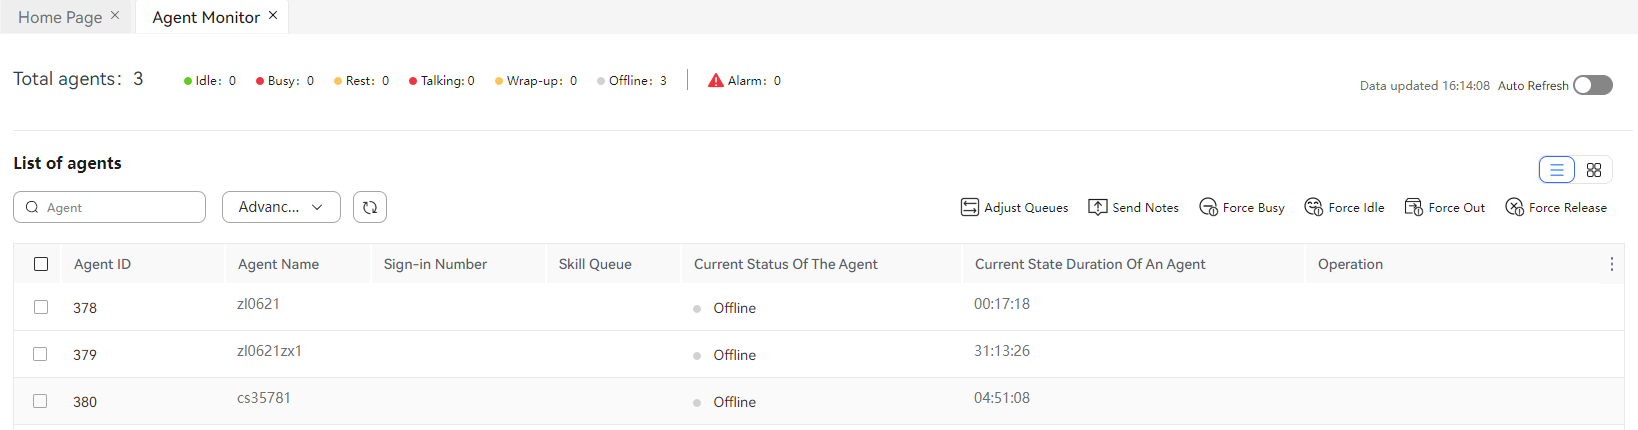
- View agent monitoring information. Click the agent monitoring button in the upper right corner. The agent monitoring page is displayed.
Figure 6 Agent monitoring
Parent topic: Making Intelligent Outbound Calls
Feedback
Was this page helpful?
Provide feedbackThank you very much for your feedback. We will continue working to improve the documentation.See the reply and handling status in My Cloud VOC.
The system is busy. Please try again later.
For any further questions, feel free to contact us through the chatbot.
Chatbot


