Topology
The topology displays the call relationships between services within a period. The statistics can be collected from the caller or the callee. You can also view the trend. On the topology, you can view the call relationships between services and check whether the calls between services are normal to quickly locate faults. The application relationships, call data (service and instance metrics), and health status are clearly displayed.
Viewing the Topology
- Log in to the APM console.
- Click
 on the left and choose Management & Governance > Application Performance Management.
 - In the navigation pane, choose Link Trace > Metrics.
- In the tree on the left, click
 next to the target environment.
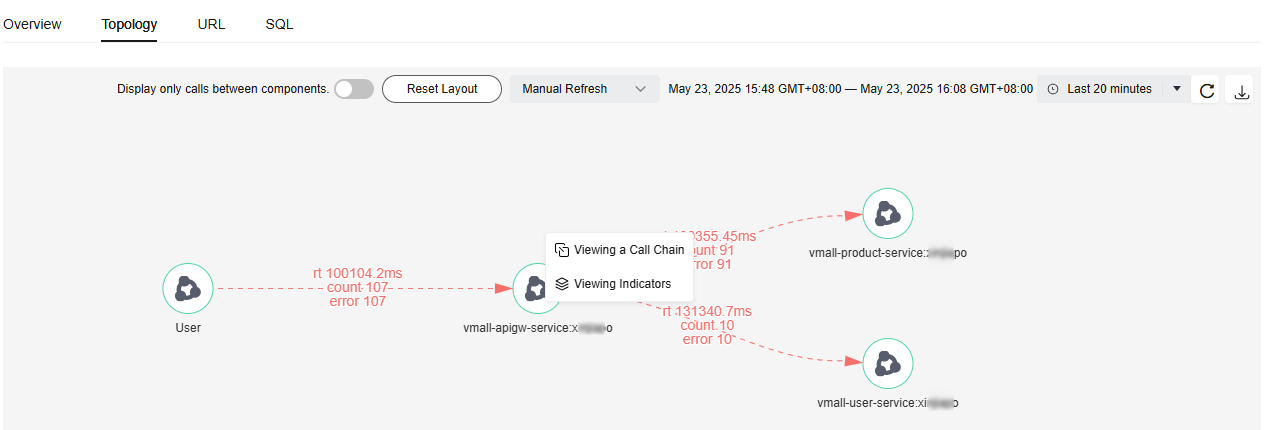
 - Switch to the Topology tab page. The call trend of the selected instance is displayed.
Figure 1 Viewing the topology

- Click
 next to Display only calls between components.
When the button turns blue, only the calls between components are displayed.
- Select the refresh setting. Default: Manual Refresh. In addition, Automatic refresh in 1 minute, Automatic refresh in 5 minutes, and Automatic refresh in 15 minutes are supported.
- Select a time range. Default: Last 20 minutes.
Options: Last 20 minutes, Last hour, Last 3 hours, Last 6 hours, Last day, Today, Yesterday, or Custom.
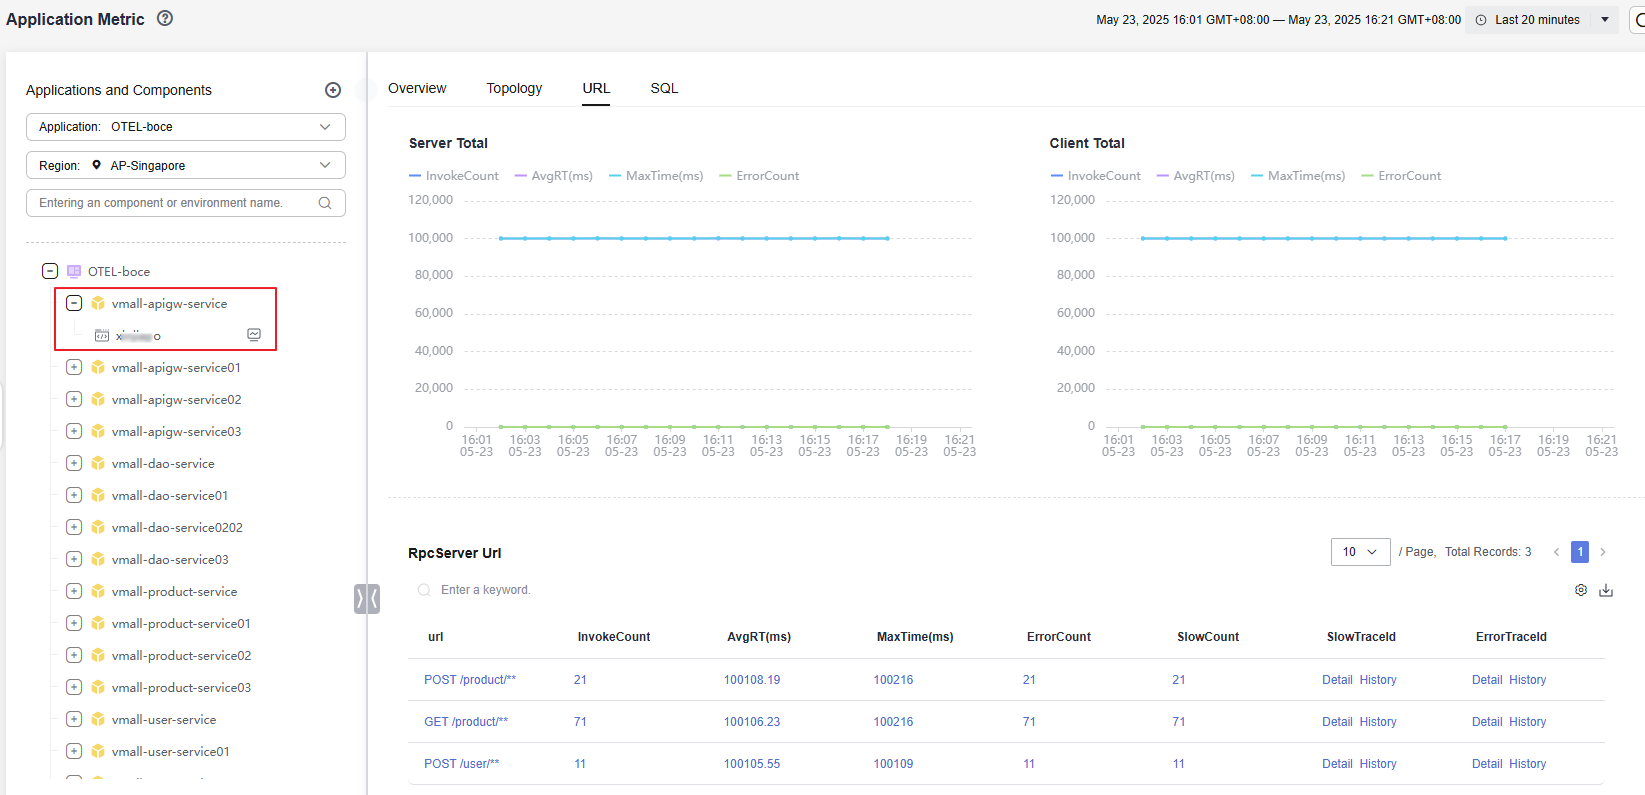
- Right-click a component and then click Viewing a Call Chain or Viewing Indicators.
Figure 2 Viewing the call chain or indicators of the component

Feedback
Was this page helpful?
Provide feedbackThank you very much for your feedback. We will continue working to improve the documentation.See the reply and handling status in My Cloud VOC.
For any further questions, feel free to contact us through the chatbot.
Chatbot


