Overview
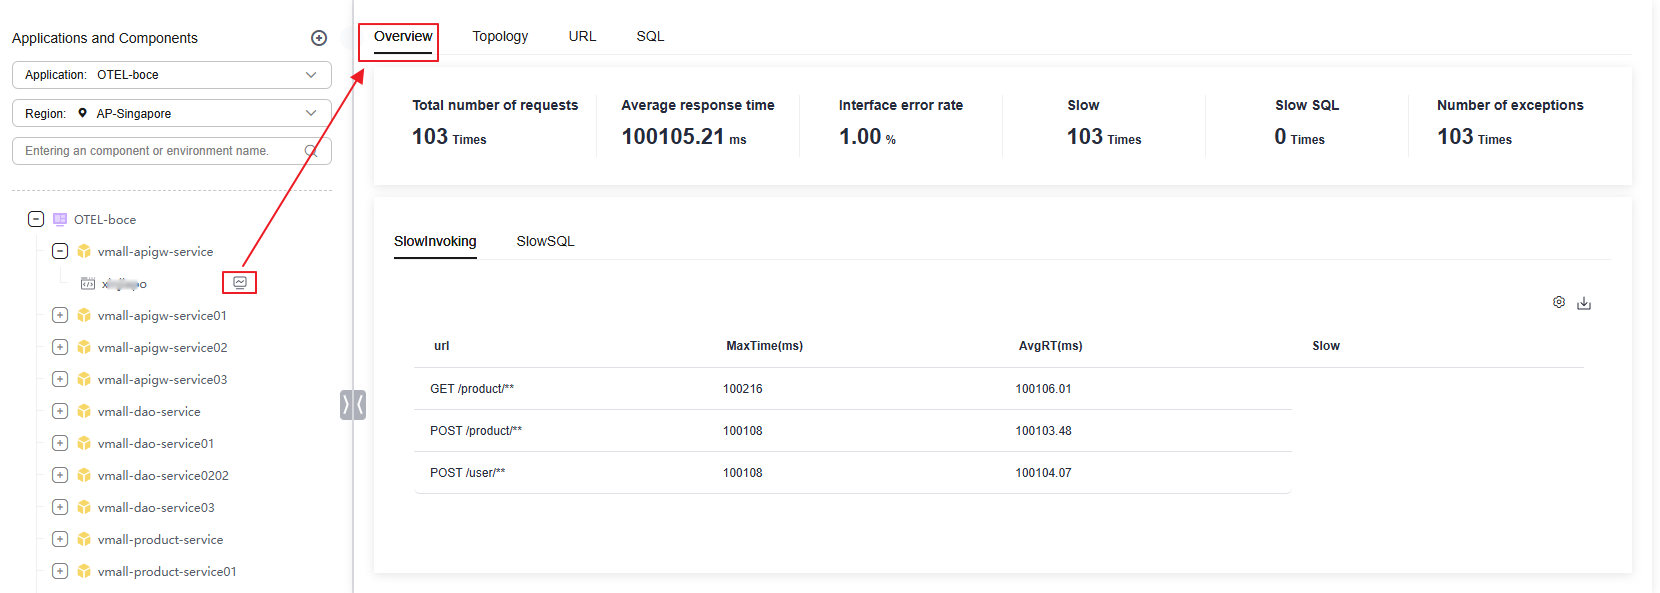
The Overview page displays the summary data of all component instances. The data includes the total number of requests, average response time, API error rate, slow calls, slow SQL statements, and number of exceptions. Slow Invoking displays the five invoking records with the longest duration, Error Invoking displays the five invoking records with the most errors, Slow SQL displays the five SQL records with the longest duration, and Exception displays the five records with the most exceptions.
- Log in to the APM console.
- Click
 on the left and choose Management & Governance > Application Performance Management.
 - In the navigation pane, choose Link Trace > Metrics.
- In the tree on the left, click the target environment and click the Overview tab. On the Overview tab page, view the application monitoring data of the instance.
- Select a time range. Default: Last 20 minutes.
Options: Last 20 minutes, Last hour, Last 3 hours, Last 6 hours, Last day, Today, Yesterday, or Custom.Figure 1 Overview

Table 1 Overview parameters Parameter
Description
Total Requests
Total number of trace requests in an environment.
Avg. Response Time
Average response time of traces in an environment.
API Error Rate
API error rate of traces in an environment.
Slow Calls
Total number of slow calls in an environment.
Slow SQL
Total number of slow SQL statements in an environment.
Exceptions
Total number of trace exceptions in an environment.
- Click
 in the upper right corner of the list and select the target metric data.
 - Click
 in the upper right corner of the list to export information. A maximum of 100 records can be exported.
 - Slow Invoking: displays the five URLs with the longest duration, maximum response time, average response time, and number of slow calls in an environment.
- Error Invoking: displays the five URLs with the most errors, maximum response time, average response time, and number of errors in an environment.
- Slow SQL: displays the five SQL statements with the longest duration, maximum response time, average response time, and number of slow SQL calls in an environment.
- Exception: displays the five URLs with the most exceptions, maximum response time, average response time, and number of exceptions in an environment.
- Click
Feedback
Was this page helpful?
Provide feedbackThank you very much for your feedback. We will continue working to improve the documentation.See the reply and handling status in My Cloud VOC.
For any further questions, feel free to contact us through the chatbot.
Chatbot


