Freezes
The Freezes page displays the freeze information, including the total number of freezes, device freeze rate, number of affected devices, number of affected versions, freeze trend, the five versions with the most freezes, the five devices with the most freezes, and freeze list.
- Log in to the APM console.
- Click
 on the left and choose Management & Governance > Application Performance Management.
 - In the navigation pane, choose App Monitoring > Freezes. The freeze data is displayed.
Table 1 Freeze parameters Parameter
Description
Total Freezes
Total number of freezes.
Device Freeze Rate
Device freeze rate = Number of the devices that encounter freezes/Total number of devices
Affected Devices
Number of devices affected by freezes.
Affected Versions
Number of versions affected by freezes.
- Select an application from the drop-down list in the upper left corner of the page.
- Select a carrier, region, device, version, and tag from the drop-down lists to view required information.
- In the upper right corner of the page, select a time range. Default: Last 20 minutes.
Freeze Trend
The freeze trend graph displays the total number of freezes and the number of affected devices. Move the cursor to the graph. The total number of freezes and the number of affected devices will be displayed.
|
Parameter |
Description |
|---|---|
|
Total Freezes |
Total number of freezes. |
|
Affected Devices |
Number of devices affected by freezes. |
The 5 Versions with the Most Freezes
A bar graph shows the 5 versions with the most freezes. Move the cursor to a version in the graph. The total number of freezes of the current version will be displayed.
|
Parameter |
Description |
|---|---|
|
Total Freezes |
Total number of freezes that a version encounters. |
The 5 Devices with the Most Freezes
A bar graph shows the 5 devices with the most freezes. Move the cursor to a device in the graph. The total number of freezes of the current device will be displayed.
|
Parameter |
Description |
|---|---|
|
Total Freezes |
Total number of freezes that a device encounters. |
Freeze List
|
Parameter |
Description |
|---|---|
|
Freeze Summary |
Freeze information summary. |
|
Type |
Freeze type. |
|
Freezes |
Number of freezes. |
|
Affected Devices |
Number of devices affected by freezes. |
|
Affected Versions |
Number of versions affected by freezes. |
|
First Occurred |
Time when the first freeze occurred. |
|
Last Occurred |
Time when the last freeze occurred. |
- In the search box in the upper left corner of the freeze list, enter a keyword about the freeze summary or type and click
 to view the freezes that meet the search criteria.
 - Click
 in the upper right corner of the freeze list and select the target metric data.
 - By default, the freeze list is sorted by Freezes in descending order.
- Click Analyze in the Operation column in the row that contains the target freeze to view details. The details include the freeze trend, 5 versions with the most freezes, 5 devices with the most freezes, and freeze list.
- In the search box in the upper left corner of the freeze list, enter a keyword about the device model/ID or freeze type and click
 to view the freezes that meet the search criteria. Note that each keyword is case sensitive.
 - Click
 in the upper right corner of the freeze list and select the target metric data.
 - By default, the freeze list is sorted by occurrence time in descending order.
- In the search box in the upper left corner of the freeze list, enter a keyword about the device model/ID or freeze type and click
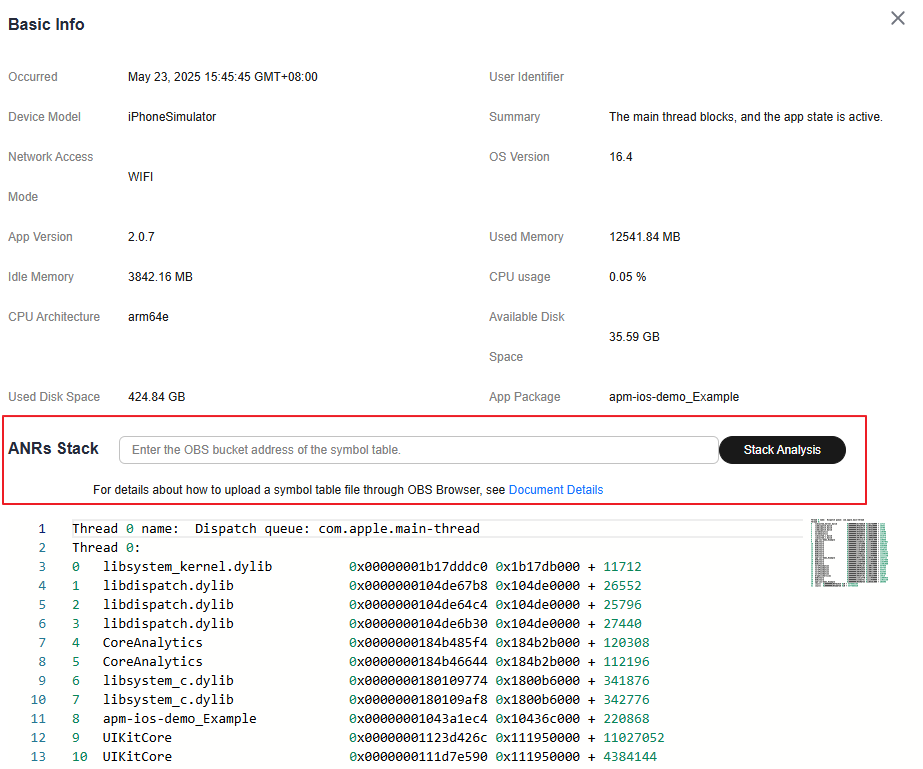
- Click View Details in the Operation column of the target device model/ID. The freeze information and stack are displayed.
Stack analysis is supported only for iOS and Android, but not for HarmonyOS.Figure 1 Freeze - Stack analysis for Android apps

Table 6 Related parameters Parameter
Description
Occurred
Time when the freeze occurred.
User Identifier
Unique identifier of the user.
Device Model
Device model.
Summary
Freeze information summary.
Network Access Mode
Network access mode of the app.
OS Version
OS version.
App Version
App version.
Used Memory
Used memory.
Idle Memory
Idle memory.
CPU Usage
CPU usage.
CPU Architecture
CPU architecture.
Available Disk Space
Available disk space.
Used Disk Space
Used disk space.
App Package
Name of the app package.
Freeze Stack
Freeze stack.
- Enter the OBS bucket address of the symbol table in the crash stack box. For details about how to upload the symbol table file, see Using OBS Console.
- Click Stack Analysis. The analysis result is displayed in the box.
Feedback
Was this page helpful?
Provide feedbackThank you very much for your feedback. We will continue working to improve the documentation.See the reply and handling status in My Cloud VOC.
For any further questions, feel free to contact us through the chatbot.
Chatbot


