
AOM Overview
The Overview page provides panoramic monitoring of resources and logs. It displays Updates, Alarm Overview, Usage Overview, Prometheus Monitoring, Log Monitoring, Common Functions, Best Practices, and FAQs.
Constraints
- LTS is available only in CN North-Beijing1, CN North-Beijing4, AP-Singapore, AF-Johannesburg, LA-Santiago, LA-Sao Paulo1, LA-Mexico City1, LA-Mexico City2, AP-Jakarta, TR-Istanbul, ME-Riyadh, CN East-Qingdao, CN East-Shanghai2, CN South-Guangzhou, CN North-Beijing2, CN-Hong Kong, AP-Bangkok, and CN East 2. To view LTS data on the Panorama page, you need to obtain the lts:logs:list, lts:topics:list, and lts:groups:list permissions in advance. For details, see Permissions.
- AOM automatically checks ICAgent versions. If AOM detects that your ICAgent is too early, a corresponding message will be displayed. You can authorize AOM to automatically upgrade the ICAgent for an ECS during off-peak hours. (You can set the auto upgrade time for the ICAgent on a CCE cluster node. For details, see Configuring Collector Auto Upgrade.) You can also go to the UniAgents page and manually upgrade the ICAgent. If you do not need to upgrade ICAgent, select Do not show again.
Viewing Overview
- Log in to the AOM 2.0 console.
- In the navigation pane, choose Overview.
- Click
 in the upper right corner of the page and select a period from the drop-down list. Options: Last 30 minutes, Last hour, Last 6 hours, Last day, and Last week.
 You can also perform the following operations if needed:
- Manual refresh: Click
 in the upper right corner of the page to manually refresh the page.
 - Automatic refresh: Click the drop-down arrow next to
 in the upper right corner of the page and select an automatic refresh interval.
- Manual refresh: Click
Updates
This card displays the new functions and corresponding documents of AOM 2.0.

Alarm Overview
This card displays the total number of alarms, number of alarms of each severity, and alarm sources. You can click alarm rules to configure alarm rules.

Usage Overview
This card displays the number of resources under Prometheus and cloud log monitoring.
- Prometheus Monitoring: displays the number of Prometheus instances. You can click Ingest Metric to go to the instance list page.
- Cloud Log Monitoring: displays the number of monitored log groups and log streams. You can click Ingest Log to go to the Log Management page.

Prometheus Monitoring
This card displays the Prometheus instances you have created. You can view the instance name, instance type, basic metrics, custom metrics, and billing mode of each instance. By default, the five Prometheus instances with the most basic metrics are displayed. You can also sort the instances by instance name, custom metrics, or billing mode.
- Usage Statistics: Click Usage Statistics to go to the Usage Statistics page and view the number of reported Prometheus instance metrics.
- Create an instance: Click Create an Instance to go to the Instances page and view or create a Prometheus instance.
- Access Center: Click Access Center to go to the Access Center page and ingest metrics to AOM.

Log Monitoring
This card displays the log read/write traffic, index traffic-standard log stream graph, and top 5 log groups with the most log streams. By default, only the top 5 log groups with the most log streams are displayed. You can sort log groups by log group name, remark, log streams, or tags.
- Usage Statistics: Click Usage Statistics to go to the Log Management page and view the log read/write traffic.
- Add Log Group: Click Add Log Group to go to the Log Management page and create a log group.
- View All: Click View All to go to the Log Management page and view all log streams.
- Access Center: Click Access Center to go to the Access Center page and ingest logs to AOM.

Common Functions
This card displays common functions of AOM.
- Customize Alarm Template: Click Customize Alarm Template to go to the Alarm Templates page and view or create an alarm template.
- Create Alarm Rule: Click Create Alarm Rule to create a metric alarm rule or an event alarm rule.
- Create Notification Rule: Click Create Notification Rule to go to the Alarm Notifications page and view or create a notification rule.
- Create Message Template: Click Create Message Template to go to the Message Templates page and view or create a message template.
- Customize Dashboard: Click Customize Dashboard to go to the Dashboard page and view or create a dashboard.

Best Practices
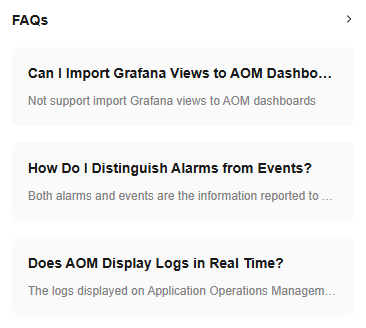
This card displays the best practices about AOM 2.0. For more details, see Best Practices.

Feedback
Was this page helpful?
Provide feedbackThank you very much for your feedback. We will continue working to improve the documentation.See the reply and handling status in My Cloud VOC.
For any further questions, feel free to contact us through the chatbot.
Chatbot


