
Creating an AOM Metric Alarm Rule
For metric alarm rules, you can set threshold conditions for resource metrics. If a metric value meets a threshold condition, AOM generates a threshold alarm. If no metric data is reported, AOM generates an insufficient data event.
Creation Mode
You can create metric alarm rules by selecting metrics from all metrics or using PromQL.
Constraints
- If you need AOM to send WeCom/DingTalk/Lark/voice call/WeLink/email/SMS notifications when the metric alarm rule status (Exceeded, Normal, Effective, or Disabled) changes, set an alarm notification rule by referring to Creating an AOM Alarm Notification Rule.
- Second-level monitoring is supported when you create metric alarm rules by selecting metrics from all metrics or using PromQL. The timeliness of metric alarms depends on the metric reporting period, rule check interval, and notification send time.
- A maximum of 3,000 metric/event alarm rules can be created.
- When enabling Intelligent alarm rule during the creation of metric alarm rules, pay attention to the following constraints:
- The Intelligent alarm rule option is not generally available. To use this function, submit a service ticket.
- During the monitoring of newly ingested metrics, results are displayed only when the collected metric data is sufficient.
- If a metric has multiple resource timelines, the Intelligent alarm rule function takes effect only for the five resource timelines with the most metrics.
- When you create metric alarm rules in multiple regions, they all together can monitor up to 30 metrics and the Intelligent alarm rule function can monitor up to 150 resource timelines.
- If metric names are excessively long or there are too many metric tags, metrics will fail to be saved to databases, affecting intelligent alarm reporting.
Creating an Alarm Rule by Selecting Metrics from All Metrics
- Log in to the AOM 2.0 console.
- In the navigation pane, choose Alarm Center > Alarm Rules.
- On the Prometheus Monitoring tab page, click Create Alarm Rule.
- Set basic information about the alarm rule by referring to Table 1.
Table 1 Basic information Parameter
Description
Original Rule Name
Original name of the alarm rule.
Enter a maximum of 256 characters and do not start or end with any special character. Only letters, digits, underscores (_), and hyphens (-) are allowed.
Rule Name
Name of a rule. Max.: 256 characters. Only letters, digits, hyphens (-), and underscores (_) are allowed. Do not start or end with a hyphen or underscore.
- If you set Rule Name, it will be displayed preferentially.
- After an alarm rule is created, you can change Rule Name but cannot change Original Rule Name. When you change Rule Name and then move the cursor over it, both Original Rule Name and Rule Name can be viewed.
Enterprise Project
Enterprise project.
- If Enterprise Project is set to All on the global settings page, select an enterprise project from the drop-down list here.
- If you have already selected an enterprise project on the global settings page, this option will be grayed and cannot be changed.
- To select the newly created enterprise project during the creation of an alarm rule, wait for about 10 minutes after the rule is created.
Description
Description of the rule. Enter up to 1,024 characters.
- Set the detailed information about the alarm rule.
- Set Rule Type to Metric alarm rule.
- Set Configuration Mode to Select from all metrics.
- Select a target Prometheus instance from the drop-down list.
- Set alarm rule details. Table 2 describes the parameters.
After the setting is complete, the monitored metric data is displayed in a line graph above the alarm condition. A maximum of 50 metric data records can be displayed. Click the line icon before each metric data record to hide the metric data in the graph. You can click Add Metric to add metrics and set the statistical period and detection rules for the metrics.
You can perform the following operations after moving the cursor to the metric data and alarm condition:
- Click
 next to an alarm condition to hide the corresponding metric data record in the graph.
 - Click
 next to an alarm condition to convert the metric data and alarm condition into a Prometheus command.
 - Click
 next to an alarm condition to quickly copy the metric data and alarm condition and modify them as required.
 - Click
 next to an alarm condition to remove a metric data record from monitoring.
Figure 1 Setting alarm rule details
Table 2 Alarm rule details Parameter
Description
Multiple Metrics
Calculation is performed based on the preset alarm conditions one by one. An alarm is triggered when one of the conditions is met.
For example, if three alarm conditions are set, the system performs calculation respectively. If any of the conditions is met, an alarm will be triggered.
Combined Operations
The system performs calculation based on the expression you set. If the condition is met, an alarm will be triggered. The combined operations function is not generally available. To use it, submit a service ticket.
For example, if there is no metric showing the CPU core usage of a host, do as follows:
- Set the metric of alarm condition "a" to aom_node_cpu_used_core and retain the default values for other parameters. This metric is used to count the number of CPU cores used by a measured object.
- Set the metric of alarm condition "b" to aom_node_cpu_limit_core and retain the default values for other parameters. This metric is used to count the total number of CPU cores that have been applied for a measured object.
- If the expression is set to "a/b", the CPU core usage of the host can be obtained.
- Set Rule to Max > 0.2.
- In the trigger condition, set Consecutive Periods to 3.
- Set Alarm Severity to Critical.
If the maximum CPU core usage of a host is greater than 0.2 for three consecutive periods, a critical alarm will be generated.
Metric
Metric to be monitored.
Click the Metric text box. In the resource tree on the right, you can also select a target metric by resource type.
Statistical Period
Metric data is aggregated based on the configured statistical period, which can be 15 seconds, 30 seconds, 1 minute, 5 minutes, 15 minutes, or 1 hour.
Condition
Metric monitoring scope. If this parameter is left blank, all resources are covered.
Each condition is in a key-value pair. You can select a dimension name from the drop-down list. The dimension value varies according to the matching mode.
- =: Select a dimension value from the drop-down list. For example, if Dimension Name is set to Host name and Dimension Value is set to 192.168.16.4, only host 192.168.16.4 will be monitored.
- !=: Select a dimension value from the drop-down list. For example, if Dimension Name is set to Host name and Dimension Value is set to 192.168.16.4, all hosts excluding host 192.168.16.4 will be monitored.
- =~: The dimension value is determined based on one or more regular expressions. Separate regular expressions by vertical bar (|). For example, if Dimension Name is set to Host name and Regular Expression is set to 192.*|172.*, only hosts whose names are 192.* and 172.* will be monitored.
- !~: The dimension value is determined based on one or more regular expressions. Separate regular expressions by vertical bar (|). For example, if Dimension Name is set to Host name and Regular Expression is set to 192.*|172.*, all hosts excluding hosts 192.* and 172.* will be monitored.
For details about how to enter a regular expression, see Regular Expression Examples.
You can also click
 and select AND or OR to add more conditions for the metric.
Grouping Condition
Aggregate metric data by the specified field and calculate the aggregation result. Options: Not grouped, avg by, max by, min by, and sum by. For example, avg by clusterName indicates that metrics are grouped by cluster name, and the average value of the grouped metrics is calculated and displayed in the graph.
Rule
Detection rule of a metric alarm, which consists of the statistical mode (Avg, Min, Max, Sum, and Samples), determination criterion (≥, ≤, >, and <), and threshold value. For example, if the detection rule is set to Avg >10, a metric alarm will be generated if the average metric value is greater than 10.
Trigger Condition
When the metric value meets the alarm condition for a specified number of consecutive periods, a metric alarm will be generated. Range: 1 to 30.
NOTE:The period refers to Check Interval set in Advanced Settings.
For example, if Statistical Period is set to 5 minutes, Consecutive Periods is set to 2, and Check Interval is set to 1 minute, the metric data within 5 minutes is calculated, and a metric alarm is triggered if the detection rule is met for two consecutive periods (a total of 2 minutes).
Alarm Severity
Metric alarm severity. Options:
 : critical alarm.
 : major alarm.
 : minor alarm.
 : warning.
- Click
- (Optional) Enable Intelligent alarm rule. You can enable Intelligent alarm rule when selecting Multiple Metrics for creating metric alarm rules. By default, Intelligent alarm rule is disabled. After it is enabled, the Sensitivity and Detection Scenario options are added to the detection rule. For details, see Table 3.
Table 3 Intelligent alarm rule parameters Parameter
Description
Rule
Detection rule for triggering a metric alarm. It consists of the statistical mode (Avg, Min, Max, Sum, and Samples) and judgment condition (> Upper limit, < Lower limit, and Beyond limit). For example, if the detection rule is set to Avg > Upper limit, an alarm is generated when the average value of the metric is greater than the upper limit.
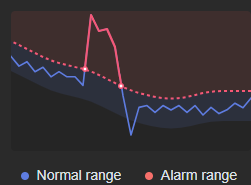
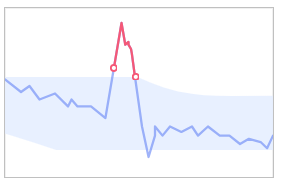
- > Upper limit: above the normal range
Figure 2 > Upper limit
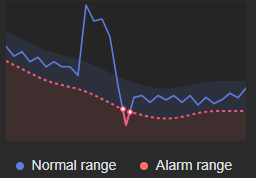
- < Lower limit: below the normal range
Figure 3 < Lower limit
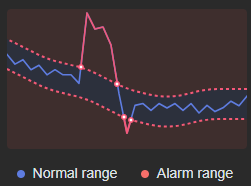
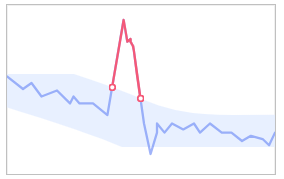
- Beyond limit: out of the normal range
Figure 4 Beyond limit
Sensitivity
The system automatically sets a dynamic threshold condition for your metric. You can select a sensitivity as required.
- High: Only small metric deviations are tolerable. A large number of alarms will be reported.
Figure 5 High sensitivity
- Middle: Moderate metric deviations are tolerable. A moderate number of alarms will be reported.
Figure 6 Middle sensitivity
- Low: Large metric deviations are tolerable. A small number of alarms will be reported.
Figure 7 Low sensitivity
Detection Scenario
You can select a scenario based on metric characteristics for precise exception detection.
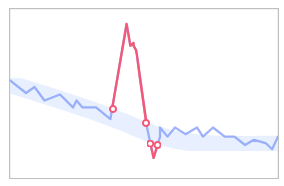
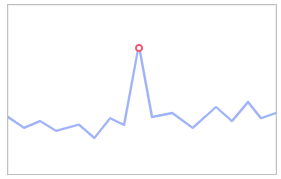
- Outlier detection: Checks for data points that diverge greatly from common data. Example: sudden data increases or decreases.
Figure 8 Outlier detection
- Periodic detection: Checks for irregularities in the growth cycle of metric data.
Figure 9 Periodic detection

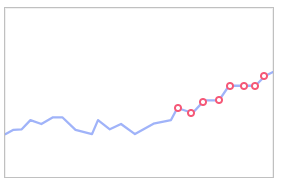
- Trend detection: Checks for unexpected increases.
Figure 10 Trend detection
- Auto detection: Automatically selects detection algorithms through characteristic extraction on data from dimensions such as periodicity, stability, and autocorrelation.
Figure 11 Auto detection
 NOTE:Normal distribution detection: Checks whether data is distributed normally.Figure 12 Normal distribution detection
- > Upper limit: above the normal range
- Set parameters such as Check Interval and Alarm Clearance. For details, see Table 4.
Table 4 Advanced settings Parameter
Description
Check Interval
Interval at which metric query and analysis results are checked.
- Hourly: Query and analysis results are checked every hour.
- Daily: Query and analysis results are checked at a fixed time every day.
- Weekly: Query and analysis results are checked at a fixed time point on a specified day of a week.
- Custom interval: The query and analysis results are checked at a fixed interval. You can set Check Interval to 15 seconds or 30 seconds to implement second-level monitoring.
- CRON: A cron expression is used to specify a time interval. Query and analysis results are checked at the specified interval.
The time specified in the cron expression can be accurate to the minute and must be in the 24-hour notation. Example: */5 * * * *, which indicates that the check starts from 0th minute and is performed every 5 minutes.
Alarm Clearance
The alarm will be cleared when the alarm condition is not met for a specified number of consecutive periods. By default, the metric data of only one period is monitored. You can monitor the metric data of up to 30 consecutive periods.
For example, if Consecutive Periods is set to 2, the alarm will be cleared when the alarm condition is not met for two consecutive periods.
Action Taken for Insufficient Data
Action to be taken when no metric data is generated or metric data is insufficient for a specified number of consecutive periods. You can set this option based on your requirements. Action Taken for Insufficient Data is disabled by default. After it is enabled, the system monitors metric data for one period by default. You can monitor metric data for a maximum of five consecutive periods.
Options: Exceeded (an alarm will be sent), Insufficient data (an event will be sent), Previous status, and Normal (an alarm clearance notification will be sent).
Tags
Click
 to add tags for alarm rules. They will be synchronized to TMS. They can be used to filter alarm rules and group alarms to reduce noise. They can also be referenced as "$event.metadata.tag key" in message templates.
Tags are alarm identification attributes in the format of "key:value". For details, see Alarm Tags and Annotations.
If tag policies have been configured in your organization, you need to add alarm tags based on these policies. If your tags do not comply with these policies, the tags may fail to be added. Contact the administrator when necessary.
Annotations
Click
 to add attributes (key-value pairs) for alarm rules. Annotations will not be synchronized to TMS, but can be used to group alarms to reduce noise and referenced as "$event.metadata.annotation key" in message templates.
Annotations are alarm non-identification attributes in the format of "key:value". For details, see Alarm Tags and Annotations.
- Set an alarm notification policy. For details, see Table 5.
Figure 13 Setting an alarm notification policy

Table 5 Parameters for setting an alarm notification policy Parameter
Description
Notify When
Set the scenario for sending alarm notifications.
- Alarm triggered: If the alarm trigger condition is met, the system sends an alarm notification to the specified personnel by email or SMS.
- Alarm cleared: If the alarm clearance condition is met, the system sends an alarm notification to the specified personnel by email or SMS.
Alarm Mode
- Direct alarm reporting: An alarm is directly sent when the alarm condition is met. If you select this mode, set an interval for notification and specify whether to enable a notification rule.
Frequency: interval for sending alarm notifications. Select a desired value from the drop-down list.
After a notification rule is enabled, the system sends notifications based on the associated SMN topic and message template. If there is no notification rule you want to select, click Add Rule in the drop-down list to create one. For details about how to set a notification rule, see Creating an AOM Alarm Notification Rule.
- Alarm noise reduction: Alarms are sent only after being processed based on noise reduction rules, preventing alarm storms.
If you select this mode, the silence rule is enabled by default. You can determine whether to enable Grouping Rule as required. After this function is enabled, select a grouping rule from the drop-down list. If existing grouping rules cannot meet your requirements, click Create Rule in the drop-down list to create one. For details, see Creating an AOM Alarm Grouping Rule. The alarm severity and tag configured in the selected grouping rule must match those configured in the alarm rule. Otherwise, the grouping rule does not take effect.
- Click Confirm. Then click View Rule to view the created alarm rule.
In the expanded list, if a metric value meets the configured alarm condition, a metric alarm is generated on the alarm page. To view it, choose Alarm Center > Alarm List in the navigation pane. If a metric value meets the preset notification policy, the system sends an alarm notification to the specified personnel by email or SMS.
Figure 14 Created metric alarm rule
Creating a Metric Alarm Rule by Selecting Metrics Using PromQL
- Log in to the AOM 2.0 console.
- In the navigation pane, choose Alarm Center > Alarm Rules.
- On the Prometheus Monitoring tab page, click Create Alarm Rule.
- Set basic information about the alarm rule by referring to Table 6.
Table 6 Basic information Parameter
Description
Original Rule Name
Original name of the alarm rule.
Enter a maximum of 256 characters and do not start or end with any special character. Only letters, digits, underscores (_), and hyphens (-) are allowed.
Rule Name
Name of a rule. Max.: 256 characters. Only letters, digits, hyphens (-), and underscores (_) are allowed. Do not start or end with a hyphen or underscore.
- If you set Rule Name, it will be displayed preferentially.
- After an alarm rule is created, you can change Rule Name but cannot change Original Rule Name. When you change Rule Name and then move the cursor over it, both Original Rule Name and Rule Name can be viewed.
Enterprise Project
Enterprise project.
- If Enterprise Project is set to All on the global settings page, select an enterprise project from the drop-down list here.
- If you have already selected an enterprise project on the global settings page, this option will be grayed and cannot be changed.
- To select the newly created enterprise project during the creation of an alarm rule, wait for about 10 minutes after the rule is created.
Description
Description of the rule. Enter up to 1,024 characters.
- Set the detailed information about the alarm rule.
- Set Rule Type to Metric alarm rule.
- Select PromQL.
- Select a target Prometheus instance from the drop-down list.
- Set alarm rule details. Table 7 describes the parameters.
After the setting is complete, the monitored metric data is displayed in a line graph above the alarm condition. A maximum of 50 metric data records can be displayed. Click the line icon before each metric data record to hide the metric data in the graph.
Figure 15 Setting alarm rule details
Table 7 Alarm rule details Parameter
Description
Default Rule
Detection rule generated based on Prometheus statements. The system provides two input modes: Custom and CCEFromProm. After the input is complete, click Query. The corresponding graph will be displayed in the lower part of the page in real time.
- Custom: If you have known the metric name and IP address and are familiar with the Prometheus statement format, select Custom from the drop-down list and manually enter a Prometheus command.
- CCEFromProm: used when you do not know the metric information or are unfamiliar with the Prometheus format. Select CCEFromProm from the drop-down list and then select a desired template from the CCE templates. The system then automatically fills in the Prometheus command based on the selected template.
You can click
 to view examples. For details, see Prometheus Statements.
Alarm Severity
Metric alarm severity. Options:
 : critical alarm.
 : major alarm.
 : minor alarm.
 : warning.
Dimensions
Metric monitoring dimension, which is automatically generated based on the Prometheus statement you set.
Duration
A metric alarm will be triggered when the alarm condition is met for the specified duration. Options: Include Immediately, 15 seconds, 30 seconds, 1 minute, 2 minutes, 5 minutes, and 10 minutes. For example, if Duration is set to 2 minutes, a metric alarm is triggered when the default rule condition is met for 2 minutes.
- Set parameters such as Check Interval and Alarm Clearance. For details, see Table 8.
Table 8 Advanced settings Parameter
Description
Check Interval
Interval at which metric query and analysis results are checked.
- XX hours: Check the query and analysis results every XX hours.
- XX minutes: Check the query and analysis results every XX minutes.
- XX seconds: Check the query and analysis results every XX seconds. You can set Check Interval to 15 seconds or 30 seconds to implement second-level monitoring.
Tags
Tags are automatically generated based on the Prometheus statement you set. You can modify them as required. Tags are alarm identification attributes in the format of "key:value".
Click
 to add tags for alarm rules. They will be synchronized to TMS. They can be used to filter alarm rules and group alarms to reduce noise. They can also be referenced as "$event.metadata.tag key" in message templates. For details, see Alarm Tags and Annotations.
If tag policies have been configured in your organization, you need to add alarm tags based on these policies. If your tags do not comply with these policies, the tags may fail to be added. Contact the administrator when necessary.
Annotations
Click
 to add attributes (key-value pairs) for alarm rules. Annotations will not be synchronized to TMS, but can be used to group alarms to reduce noise and referenced as "$event.metadata.annotation key" in message templates.
Annotations are alarm non-identification attributes in the format of "key:value". For details, see Alarm Tags and Annotations.
- Set an alarm notification policy. For details, see Table 9.
Figure 16 Setting an alarm notification policy

Table 9 Parameters for setting an alarm notification policy Parameter
Description
Notify When
Set the scenario for sending alarm notifications.
- Alarm triggered: If the alarm trigger condition is met, the system sends an alarm notification to the specified personnel by email or SMS.
- Alarm cleared: If the alarm clearance condition is met, the system sends an alarm notification to the specified personnel by email or SMS.
Alarm Mode
- Direct alarm reporting: An alarm is directly sent when the alarm condition is met. If you select this mode, set an interval for notification and specify whether to enable a notification rule.
Frequency: interval for sending alarm notifications. Select a desired value from the drop-down list.
After a notification rule is enabled, the system sends notifications based on the associated SMN topic and message template. If the existing alarm notification rules cannot meet your requirements, click Add Rule in the drop-down list to create one. For details about how to set a notification rule, see Creating an AOM Alarm Notification Rule.
- Alarm noise reduction: Alarms are sent only after being processed based on noise reduction rules, preventing alarm storms.
If you select this mode, the silence rule is enabled by default. You can determine whether to enable Grouping Rule as required. After this function is enabled, select a grouping rule from the drop-down list. If existing grouping rules cannot meet your requirements, click Create Rule in the drop-down list to create one. For details, see Creating an AOM Alarm Grouping Rule. The alarm severity and tag configured in the selected grouping rule must match those configured in the alarm rule. Otherwise, the grouping rule does not take effect.
Notification Template
Alarm notification content to be sent. This content is automatically generated when Default Rule is set to CCEFromProm.
- You can use variables (that is, dimensions) in a notification template. The format is "${Dimension}".
- Click Confirm. Then click View Rule to view the created alarm rule.
In the expanded list, if a metric value meets the configured alarm condition, a metric alarm is generated on the alarm page. To view it, choose Alarm Center > Alarm List in the navigation pane. If a metric value meets the preset notification policy, the system sends an alarm notification to the specified personnel by email or SMS.
Figure 17 Created metric alarm rule
Feedback
Was this page helpful?
Provide feedbackThank you very much for your feedback. We will continue working to improve the documentation.See the reply and handling status in My Cloud VOC.
For any further questions, feel free to contact us through the chatbot.
Chatbot


