Creating AOM Alarm Rules in Batches
An alarm template is a combination of alarm rules based on cloud services. You can use an alarm template to create threshold alarm rules, event alarm rules, or PromQL alarm rules for multiple metrics of one cloud service in batches.
Constraints
You can create up to 150 alarm templates. If the number of alarm templates reaches 150, delete unnecessary templates and create new ones. The alarm template function is not generally available. To use it, submit a service ticket.
Background
AOM presets default alarm templates for key metrics (including CPU usage, physical memory usage, host status, and service status) of all hosts and services. They are displayed on the Alarm Templates > Default page. You can locate the desired default alarm template and click  in the Operation column to quickly customize your own alarm template.
Creating an Alarm Template
- Log in to the AOM 2.0 console.
- In the navigation pane, choose Alarm Center > Alarm Templates.
- On the Prometheus Monitoring tab page, click Create Custom Template.
- In the Select Alarm Source dialog box, select Prometheus monitoring and click Create Custom Template.
- Set the basic information about an alarm template. Table 1 describes the parameters.
Table 1 Basic information Parameter
Description
Template Name
Name of an alarm template. Enter a maximum of 100 characters and do not start or end with an underscore (_) or hyphen (-). Only letters, digits, underscores, and hyphens are allowed.
Enterprise Project
Enterprise project.
- If Enterprise Project is set to All on the global settings page, select an enterprise project from the drop-down list here.
- If you have already selected an enterprise project on the global settings page, this option will be grayed and cannot be changed.
- To select the newly created enterprise project during the creation of an alarm template, wait for about 10 minutes after the template is created.
Description
Description of the template. Enter up to 1024 characters.
- Add a cloud service to be monitored and an alarm rule to the template.
- Select a desired cloud service from the drop-down list.
- Switch to your desired cloud service tab. Then add an alarm rule for the cloud service. For details, see Table 2.
Figure 1 Adding an alarm rule for the cloud service

Table 2 Parameters for adding an alarm rule for the cloud service Cloud Service
Alarm Rule Type
Method
FunctionGraph, DRS, RDS, NAT, VPC, DCS, CSS, DC, CBR, DMS, ELB, EVS, OBS, DDS, and WAF
Metric alarm rule
- Click Add Threshold Alarm Rule.
- In the displayed dialog box, set the rule name, metric data, and alarm condition. For details, see 5.d and 7 in Creating an Alarm Rule by Selecting Metrics from All Metrics.
- Click OK.
CCEFromProm
Event alarm rule
See 7.
PromQL alarm rule
See 8.
CCI2
PromQL alarm rule
- Click Add PromQL Alarm Rule.
- In the displayed Create Rule dialog box, set the original rule name, default rule, and alarm severity. For details about the parameters, see Table 4.
- Click OK.
- (Optional) Add an event alarm rule for the CCEFromProm service.
- Choose Add Alarm Rule > Add Event Alarm Rule.
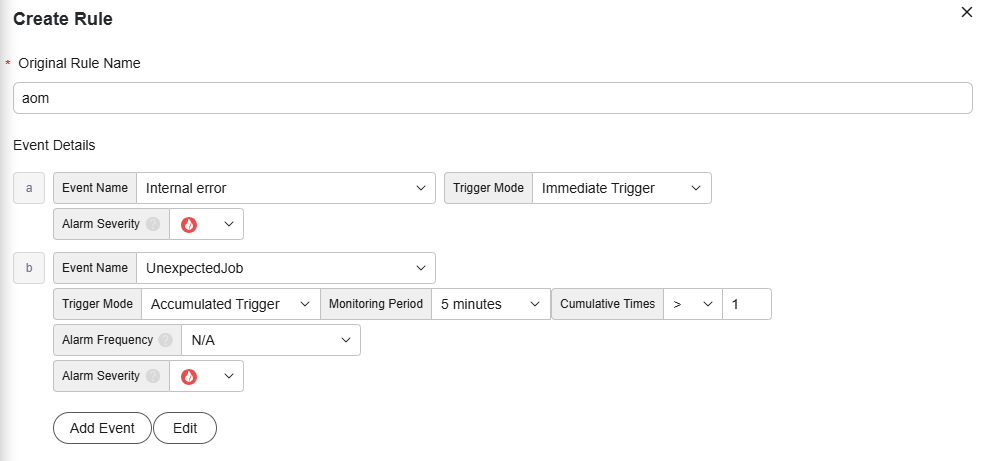
- In the displayed Create Rule dialog box, set the original rule name and event details. For details, see Table 3.
- You can click Add Event to add more events and set information such as the trigger mode and alarm severity for the events.
- In case of multiple events, click Batch Set to set alarm conditions for these events in batches.
- Click
 next to the event details to copy them and then modify them as required.
Figure 2 Adding an event alarm rule
Table 3 Event rule parameters Parameter
Description
Original Rule Name
Enter a maximum of 256 characters and do not start or end with an underscore (_) or hyphen (-). Only letters, digits, underscores, and hyphens are allowed.
Event Name
Select a value from the drop-down list. By default, all events are selected.
Trigger Mode
Trigger mode of an event alarm.
- Accumulated Trigger: When the trigger condition is met for a specified number of times in a monitoring period, alarm notifications are sent based on the preset interval.
Assume that you set Event Name to VolumeResizeFailed, Monitoring Period to 20 minutes, Cumulative Times to 3, and Alarm Frequency to Every 5 minutes. If data volume scale-out fails three times within 20 minutes, an alarm notification will be sent every five minutes unless the alarm is cleared.
- Immediate Trigger: An alarm is immediately generated when the trigger condition is met.
Alarm Severity
Event alarm severity. Options: : critical alarm.
 : major alarm.
 : minor alarm.
 : warning.
- Click OK.
- (Optional) Add a PromQL alarm rule for the CCEFromProm or CCI2 service.
- Choose Add Alarm Rule > Add PromQL Alarm Rule.
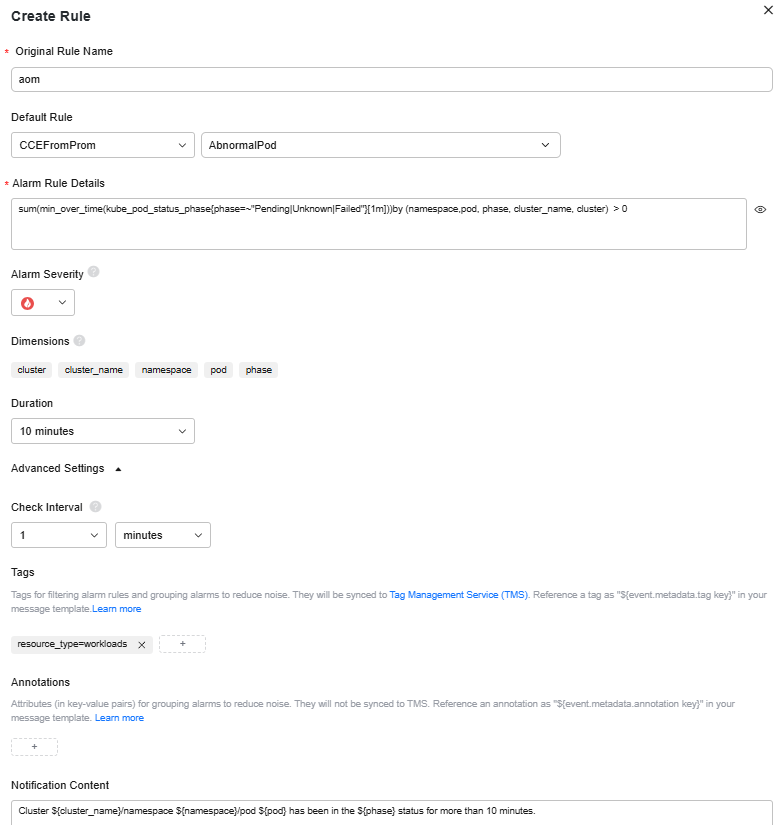
- In the displayed Create Rule dialog box, set the original rule name, default rule, and alarm severity. For details, see Table 4.
Figure 3 Adding a PromQL alarm rule

Table 4 PromQL alarm rule parameters Parameter
Description
Original Rule Name
Enter a maximum of 256 characters and do not start or end with an underscore (_) or hyphen (-). Only letters, digits, underscores, and hyphens are allowed.
Default Rule
Detection rule generated based on Prometheus statements. The system supports the following two input modes:
- Custom: If you have known the metric name and IP address and are familiar with the Prometheus statement format, select Custom from the drop-down list and manually enter a Prometheus command.
- CCEFromProm: used when you do not know the metric information or are unfamiliar with the Prometheus format. Select CCEFromProm from the drop-down list and then select a desired template from the CCE templates. The system then automatically fills in the Prometheus command based on the selected template.
Click
 next to the alarm rule details to lock the content. Then you can perform the following operations:
- Click
 next to the alarm rule details to unlock the content.
 - Click
 next to the alarm rule details to copy the Prometheus statement.
For details, see Prometheus Statements.
Alarm Severity
Metric alarm severity. Options: : critical alarm.
 : major alarm.
 : minor alarm.
 : warning.
Dimensions
Metric monitoring dimension, which is automatically generated based on the Prometheus statement you set.
Duration
A metric alarm will be triggered when the alarm condition is met for the specified duration. Options: Include Immediately, 15 seconds, 30 seconds, 1 minute, 2 minutes, 5 minutes, and 10 minutes. For example, if Duration is set to 2 minutes, a metric alarm is triggered when the default rule condition is met for 2 minutes.
Advanced Settings
Check Interval
Interval at which metric query and analysis results are checked.
- XX hours: Check the query and analysis results every XX hours.
- XX minutes: Check the query and analysis results every XX minutes.
- XX seconds: Check the query and analysis results every XX seconds.
You can set Check Interval to 15 seconds or 30 seconds to implement second-level monitoring. The timeliness of metric alarms depends on the metric reporting period, rule check interval, and notification send time.
For example, if the metric reporting period is 15 seconds, rule check interval is 15 seconds, and notification send time is 3 seconds, an alarm can be detected and an alarm notification can be sent within 33 seconds.
Tags
Tags are alarm identification attributes in the format of "key:value".
Tags are automatically generated based on the Prometheus statement you set. You can modify them as required. Click
 to add tags for alarm rules. They will be synchronized to TMS. They can be used to filter alarm rules and group alarms to reduce noise. They can also be referenced as "$event.metadata.tag key" in message templates. For details, see Alarm Tags and Annotations.
If tag policies related to AOM have already been set, add alarm tags based on these policies. If a tag does not comply with the policies, tag addition may fail. Contact your organization administrator to learn more about tag policies.
Annotations
Click
 to add annotations (key-value pairs) for alarm rules. They will not be synchronized to TMS, but can be used to group alarms to reduce noise. They can also be referenced as "$event.metadata.annotation key" in message templates. Alarm annotations are attributes that cannot be used to identify alarms. For details, see Alarm Tags and Annotations.
Notification Content
Alarm notification content to be sent. This content is automatically generated when Default Rule is set to CCEFromProm.
- Click OK.
- (Optional) Manage variables. When adding a PromQL alarm rule to the CCEFromProm or CCI2 service, manage variables and apply them to the alarm template PromQL.
- Click Manage Variable.
- In the displayed dialog box, set variable names and values. A maximum of 50 variables can be added.
Figure 4 Managing variables

- Click OK.
- Click OK to create the alarm template.
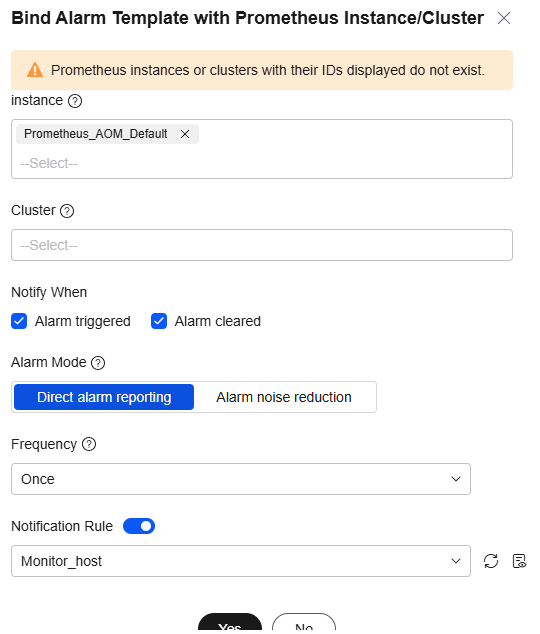
- (Optional) In the displayed Bind Alarm Template with Prometheus Instance/Cluster dialog box, set the cluster or Prometheus instance to be bound with the alarm template. For details about the parameters, see Table 5. After the settings are complete, click OK.
Figure 5 Binding an alarm template with a Prometheus instance or cluster

Table 5 Parameters for binding an alarm template Parameter
Description
Instance
This parameter is optional. If the cloud services selected in 6.a contain services other than CCEFromProm, this parameter will be displayed.
The drop-down list displays all Prometheus instances for cloud services/multi-account aggregationand the default/common Prometheus instances under your account. Select your desired instance.
If the cloud service selected in 6.a is CCI2 only, you can only associate common Prometheus instances.
Cluster
This parameter is optional. If the cloud services selected in 6.a contain CCEFromProm, this parameter will be displayed.
The drop-down list displays all CCE clusters of your account. Select your desired cluster. To associate an alarm template with a CCE cluster, obtain the CCE permission in advance. For details, see Permissions.
Notify When
Set the scenario for sending alarm notifications.
- Alarm triggered: If the alarm trigger condition is met, the system sends an alarm notification to the specified personnel by email or SMS.
- Alarm cleared: If the alarm clearance condition is met, the system sends an alarm notification to the specified personnel by email or SMS.
Alarm Mode
- Direct alarm reporting: An alarm is directly sent when the alarm condition is met. If you select this mode, set an interval for notification and specify whether to enable a notification rule.
Frequency: interval for sending alarm notifications. Select a desired value from the drop-down list.
After a notification rule is enabled, the system sends notifications based on the associated SMN topic and message template. If the existing alarm notification rules cannot meet your requirements, click Add Rule in the drop-down list to create one. For details about how to set a notification rule, see Creating an AOM Alarm Notification Rule.
- Alarm noise reduction: Alarms are sent only after being processed based on noise reduction rules, preventing alarm storms.
If you select this mode, the silence rule is enabled by default. You can determine whether to enable Grouping Rule as required. After this function is enabled, select a grouping rule from the drop-down list. If existing grouping rules cannot meet your requirements, click Create Rule in the drop-down list to create one. For details, see Creating an AOM Alarm Grouping Rule.
The alarm severity and tag configured in the selected grouping rule must match those configured in the alarm rule. Otherwise, the grouping rule does not take effect.
- View the created alarm template on the Custom tab page.
If a resource or metric meets the alarm condition set in the alarm template, an alarm will be triggered. In the navigation pane, choose Alarm Center > Alarm List to view the alarm. The system also sends alarm notifications to specified personnel by email or SMS.
Figure 6 Creating an alarm template
Importing an Alarm Template
If there are created custom alarm templates and you need to reuse the alarm templates of other regions or tenants, export the template files and then import them to quickly create alarm templates.
- Log in to the AOM 2.0 console.
- In the navigation pane on the left, choose Alarm Center > Alarm Templates. On the Prometheus Monitoring tab page, click Custom. On the displayed page, choose
 > Export in the Operation column of the target alarm template.
 - Log in to the AOM 2.0 console in the target region. In the navigation pane, choose Alarm Center > Alarm Templates.
- Go to the Prometheus Monitoring tab page. Click Import Alarm Template.
- In the Import Alarm Template dialog box, set parameters and upload the alarm template file (JSON) exported in 2. For details about the parameters, see Table 6. Click OK.
Figure 7 Importing an alarm template

Table 6 Parameters for importing an alarm template Parameter
Description
Template Name
Name of an alarm template. Enter a maximum of 100 characters and do not start or end with an underscore (_) or hyphen (-). Only letters, digits, underscores, and hyphens are allowed.
Enterprise Project
Enterprise project. Select a value from the drop-down list.
Template File
Directly upload or drag a JSON file to the box to upload.
You can export the JSON file by exporting an alarm template. On the Custom tab page under Prometheus Monitoring, choose
 > Export in the Operation column of the target alarm template.
 - View the created alarm template on the Custom tab page.
More Operations
After the alarm template is created, you can also perform the operations listed in Table 7.
|
Operation |
Description |
|---|---|
|
Checking a Prometheus alarm template |
In the template list, check the information such as Template Name, Alarm Rules/Conditions, Associated Cluster, and Enterprise Project. |
|
Binding alarm templates with Prometheus instances/clusters |
Click |
|
Modifying an alarm template |
Choose |
|
Exporting a custom alarm template |
Choose |
|
Copying an alarm template |
Click |
|
Deleting an alarm template |
|
|
Searching for an alarm template |
Enter a template name in the search box in the upper right corner and click |
|
Viewing alarm rules created using a template |
In the navigation pane on the left, choose Alarm Center > Alarm Rules. Enter a template name keyword in the search box above the alarm rule list and click |
|
Viewing alarms |
When the metric value of a resource meets an alarm condition, an alarm will be generated. In the navigation pane, choose Alarm Center > Alarm List. On the Alarms tab page, view alarms. For details, see Checking AOM Alarms or Events. |
|
Viewing events |
When no metric data is reported during the configured consecutive periods, the system reports an insufficient data event. In the navigation pane, choose Alarm Center > Alarm List. On the Events tab page, check events. For details, see Checking AOM Alarms or Events. |
Feedback
Was this page helpful?
Provide feedbackThank you very much for your feedback. We will continue working to improve the documentation.See the reply and handling status in My Cloud VOC.
For any further questions, feel free to contact us through the chatbot.
Chatbot


