Viewing DWS Database Details
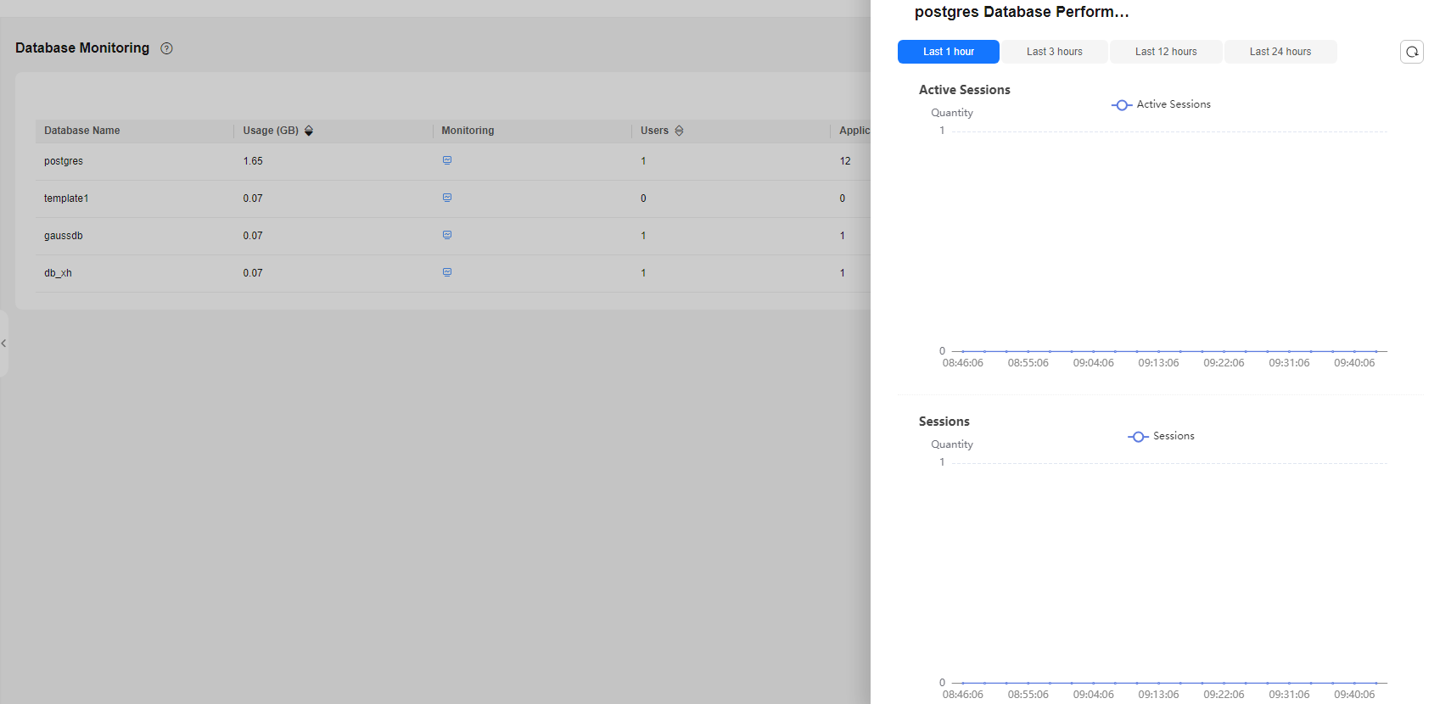
The Database Monitoring page displays the real-time and historical resource consumption a database.
Database Monitoring
- Log in to the DWS console.
- Choose Dedicated Clusters > Clusters and locate the cluster to be monitored.
- In the Operation column of the target cluster, click Monitoring Panel. The database monitoring page is displayed.
- In the navigation pane on the left, choose Monitoring > Database Monitoring.
Database Resource Consumption
You can select a database to view its resource usage and performance metrics. For details about the metrics, see Table 1.

|
Metric Name |
Description |
Monitoring Interval (Raw Data) |
|---|---|---|
|
Database Name |
Name of the database |
180s |
|
Usage (GB) |
Used capacity of the database |
180s |
|
Monitoring |
You can click the monitoring icon to view the number of queries, number of sessions, and capacity of the database. |
- |
|
Users |
Number of users in the database |
180s |
|
Applications |
Number of applications in the database |
180s |
|
Sessions |
Number of database sessions |
180s |
|
Queries |
Number of queries in the database |
180s |
|
Number of Inserted Rows |
Number of rows inserted by queries in this database |
180s |
|
Number of Updated Rows |
Number of rows updated by queries in this database |
180s |
|
Number of Deleted Rows |
Number of rows deleted by queries in this database |
180s |
|
Deadlocks |
Number of deadlocks detected in this database |
180s |
|
Temporary Files |
Number of temporary files created by queries in this database. |
180s |
|
Temporary File Capacity |
Total amount of data written to temporary files by queries in this database. |
180s |
Feedback
Was this page helpful?
Provide feedbackThank you very much for your feedback. We will continue working to improve the documentation.See the reply and handling status in My Cloud VOC.
For any further questions, feel free to contact us through the chatbot.
Chatbot


