DWS_2000000001 Node CPU Usage Exceeds the Threshold
Description
DWS collects the CPU usage of each node in a cluster every 30 seconds. If the average CPU usage of a node in the last 10 minutes (configurable) exceeds 90% (configurable), an alarm is reported indicating that the node CPU usage exceeds the threshold. If the average usage is lower than 85% (that is, the reporting threshold minus 5%), the alarm is cleared.

If the average CPU usage of a node is always greater than the alarm threshold, the alarm is generated again 24 hours (configurable).
Attributes
|
Alarm ID |
Alarm Category |
Alarm Severity |
Alarm Type |
Service Type |
Auto Cleared |
|---|---|---|---|---|---|
|
DWS_2000000001 |
Tenant plane |
Urgent: > 90% |
Operation alarm |
DWS |
Yes |
Parameters
|
Category |
Name |
Description |
|---|---|---|
|
Location information |
Name |
Node CPU Usage Exceeds the Threshold |
|
Type |
Operation alarm |
|
|
Generation time |
Time when the alarm is generated |
|
|
Other information |
Cluster ID |
Cluster details such as resourceId and domain_id |
Impact on the System
If the CPU usage is high for a long time, service processes may respond slowly or become unavailable.
Possible Causes
- Complex services occupy a large number of CPU resources.
- The CPU configuration of the cluster is too low to meet service requirements.
Handling Procedure
- Check the CPU usage of each node.
- Log in to the DWS console.
- Choose Monitoring > Alarm, select the cluster for which the alarm is generated in the cluster selection drop-down list in the upper right corner, view the alarm information of the cluster in the last seven days, and locate the name of the node for which the alarm is generated based on the location information.
- Choose Dedicated Clusters > Clusters, locate the row that contains the cluster for which the alarm is generated, and click Monitoring Panel in the Operation column.
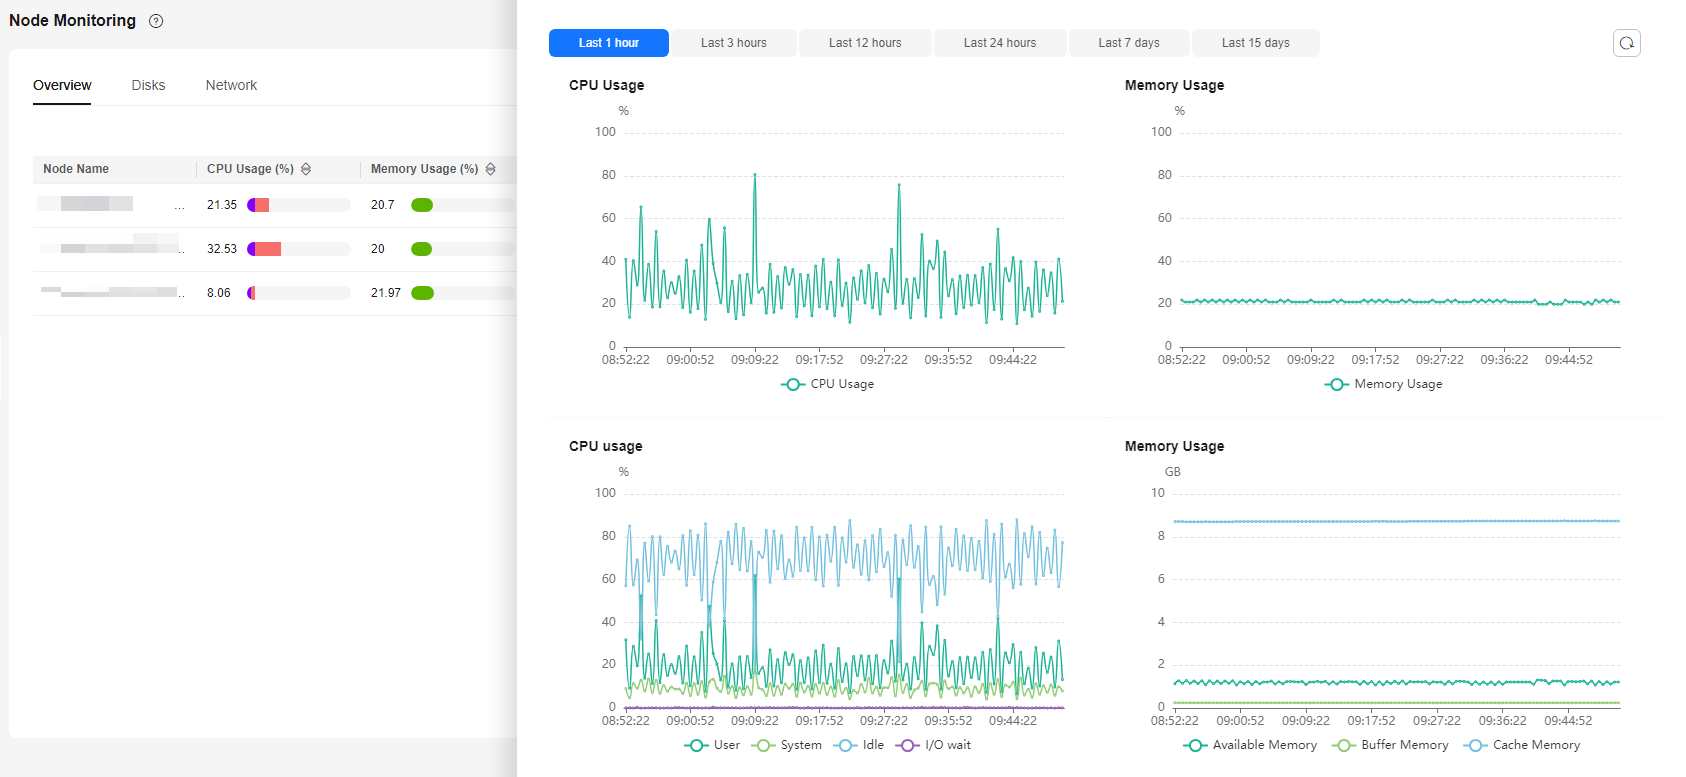
- Choose Monitoring > Node Monitoring > Overview to view the CPU usage of each node in the current cluster. Click
 on the right to view the CPU performance metrics in the last 1, 3, 12, or 24 hours and see whether there is a sharp increase in the CPU usage.

- If the CPU usage frequently increases and then returns to normal in a short period of time, it indicates that the CPU usage temporarily spikes during service execution. In this case, you can adjust the alarm threshold through 2 to reduce the number of reported alarms.
- If the CPU usage remains high for a long time, it indicates that the cluster is overloaded. In this case, check cluster services by referring to 3 or enhance the cluster flavor. For details, see Changing the Node Flavor.
- Check whether the CPU usage alarm configuration is proper.
- Choose Monitoring > Alarm and click View Alarm Rule.
- Locate the row that contains the Node CPU Usage Exceeds the Threshold, and click Modify in the Operation column. The Modifying an Alarm Rule page is displayed.
- Adjust the alarm threshold and detection period. A higher alarm threshold and a longer detection period indicate a lower alarm sensitivity. For details about the GUI configuration, see Alarm Rules.
- Check whether the CPU usage of the current cluster service is too high.
- Choose Dedicated Clusters > Clusters, locate the row that contains the target cluster, and click Monitoring Panel in the Operation column.
- On the monitoring page, choose Monitoring > Real-Time Queries, click
 , and select CPU Time (ms) to view the query with the longest CPU time.
Figure 1 Viewing CPU time information
- After confirming with the service side, select the query ID to be stopped and click Stop Query.
Figure 2 Terminating a query

- See advanced tuning operations in "Troubleshooting" > "Cluster Performance".
Alarm Clearance
After the CPU usage decreases, the alarm is automatically cleared.
Feedback
Was this page helpful?
Provide feedbackThank you very much for your feedback. We will continue working to improve the documentation.See the reply and handling status in My Cloud VOC.
For any further questions, feel free to contact us through the chatbot.
Chatbot


