

Managing Slow Query Logs
Scenarios
Slow query logs record statements that exceed the long_query_time value (1 second by default). You can view log details and statistics to identify statements that are executing slowly and optimize the statements. You can also download slow query logs for service analysis.
Constraints
Original logs will be automatically deleted 30 days later. If the instance is deleted, its logs are also deleted.
Parameter Description
| Parameter | Description |
|---|---|
| long_query_time | Any SQL statement whose execution time reaches or exceeds the value of this parameter is written to the slow query log. The value can be specified to a resolution of microseconds. The default value is 1 (unit: second). The recommended value is 1s. Note: The lock wait time is not calculated into the query time. Modifying long_query_time takes effect globally. After the modification, the new value is applied to new connections. The existing connections still use the old value. |
| log_queries_not_using_indexes | Specifies whether to record slow queries without indexes. The default value is OFF. |
| log_throttle_queries_not_using_indexes | Limits the number of SQL statements without indexes per minute that can be written to slow query logs. The default value is 0. |
Viewing Slow Query Logs
- Log in to the RDS console.
- Click
 in the upper left corner and select a region.
 - On the Instances page, click the target instance name.
- In the navigation pane, choose Logs and click the Slow Query Logs tab.
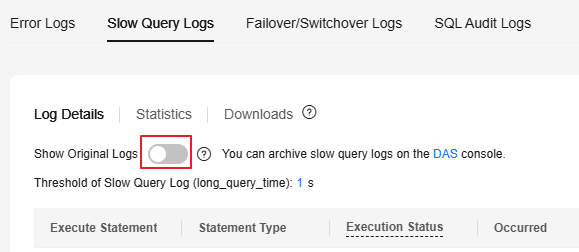
- On the Log Details tab page, turn on the toggle switch
 next to Show Original Logs.
 Alternatively, on the Instances page, select multiple RDS for MySQL instances and choose More > Configure Slow Query Log Sensitization above the instance list to enable this function for all the selected instances. You can enable it for up to 50 instances at a time.
Figure 1 Turning on Show Original Logs
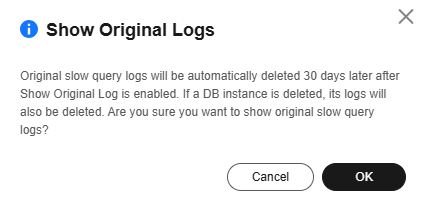
- In the displayed dialog box, click OK. Figure 2 Submitting the request
- Log in to the RDS console.
- Click in the upper left corner and select a region.
- On the Instances page, click the target instance name.
- In the navigation pane, choose Logs and click the Slow Query Logs tab.
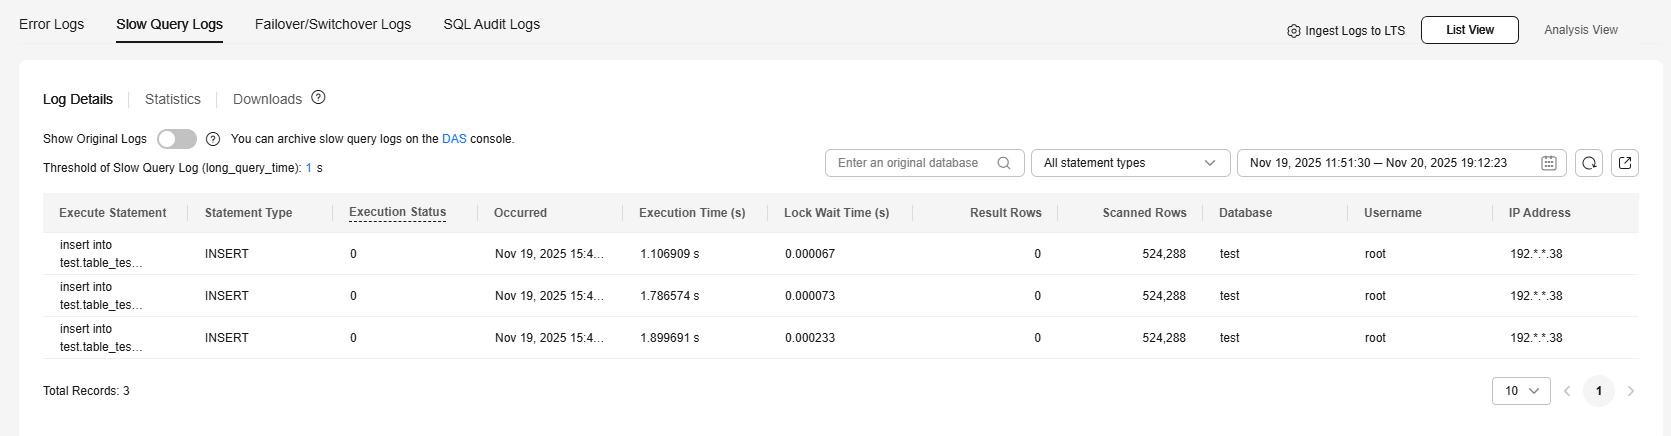
- On the Log Details tab page, you can view the slow query log records of a specific statement type or time range. Figure 3 Slow query log details
- The long_query_time parameter determines how long a SQL statement must run before it is recorded in the slow query log. Changes to this parameter apply only to queries logged after the modification. For example, if the value of this parameter is changed from 1 to 0.1 (unit: second), RDS starts recording statements that meet the new threshold and still displays the previously recorded logs that do not meet the new threshold.
- A maximum of 2,000 slow query log records can be queried. To view more slow query log records, submit a service ticket.
- To export log details, you can export them by time range. A maximum of 1,000 records can be exported at a time.
Table 2 Slow query log details Parameter
Description
Execute Statement
The slow query log records only statements that have been executed and whose execution time exceeds the threshold. Statements still in progress are not logged.
If the length of a single line of a SQL statement exceeds 10 KB or the statement has more than 200 lines, the SQL statement will be truncated. SQL statements in the slow query log details may appear incomplete because they have been specially processed, so they are for reference only.
Statement Type
- You can choose a statement type from the drop-down list in the upper right corner. Options include: All types, SELECT, INSERT, UPDATE, DELETE, CREATE, CALL, ALTER, TRUNCATE, RENAME, FLUSH, EXPLAIN, LOCK, GRANT, REVOKE, COMMIT, ROLLBACK, DROP, and WITH.
- You can also click
 in the upper right corner to select a time range and view slow query logs for different periods.
 Only slow query logs generated within the last month can be viewed.
Execution Status
Execution status of a SQL statement. If the execution status is displayed as 0, execution of the SQL statement is properly completed. However, if the SQL statement is forcibly terminated, its execution status is not 0.
The execution status is left blank if the version is 5.7.23 or earlier, 5.6.41 or earlier, or if log_slow_extra is disabled.
- 0: The SQL statement execution is successful.
- 1: Data is corrupted.
- 1053: The server is disconnected.
- 1317: The SQL statement execution is interrupted.
- 3024: The SQL statement execution times out.
Occurred
UTC time when the slow SQL statement starts to be executed.
Execution Time (s)
Duration of the slow SQL query.
Lock Wait Time (s)
Time spent waiting for both table locks and row locks.
Result Rows
Only SELECT statements return the number of result rows (column Result Rows). The number of result rows for the INSERT, UPDATE, DELETE, and CREATE statements is 0 by default.
Scanned Rows
Number of data rows that are actually accessed and processed during the SQL execution.
Database
Database where the SQL statement is executed on.
You can filter slow query logs by specifying a database name (only exact searches work and special characters are not allowed).
Username
Account that executed the SQL statement.
IP Address
Host used to connect to the database. The value is localhost for local login.
- Log in to the RDS console.
- Click in the upper left corner and select a region.
- On the Instances page, click the target instance name to go to the Summary page.
- In the navigation pane, choose Logs and click the Slow Query Logs tab.
- Click the Statistics tab. Figure 4 Statistics

- On the Statistics page, only the latest 5,000 slow SQL queries within a specified period are analyzed.
- To export statistics, you can export them by time range. A maximum of 1,000 records can be exported at a time.
Table 3 Slow query log statistics Parameter
Description
Execute Statement
- On the Statistics page, only one of the SQL statements of the same type is displayed as an example. For example, if two select sleep(N) statements, select sleep(1) and select sleep(2), are executed in sequence, only select sleep(1) will be displayed.
- If Show Original Logs is enabled, all of the slow SQL statements are displayed. For example, if select sleep(1) and select sleep(2) are executed in sequence, both of them will be recorded in the log.
Statement Type
You can choose a statement type from the drop-down list in the upper right corner. Options include: All types, SELECT, INSERT, UPDATE, DELETE, CREATE, CALL, ALTER, TRUNCATE, RENAME, FLUSH, EXPLAIN, LOCK, GRANT, REVOKE, COMMIT, ROLLBACK, DROP, and WITH.
No. and Ratio of SQL Executions
Number of times that this type of SQL statement was executed slowly in the selected time range, along with the percentage it represents out of all slow SQL statements during the same period.
Avg. Execution Time (s)
Average duration of slow SQL queries within the selected time range.
Avg. Lock Waiting Time (s)
Average lock wait time within the selected time range.
Avg. No. of Result Rows
Average number of result rows in the selected period.
Avg. No. of Scanned Rows
Average number of scanned rows in the selected period.
Database
Database where the SQL statement is executed on. If any database name in slow query log statistics contains special characters (such as < > '), the special characters will be escaped.
You can filter slow query log statistics by specifying a database name (only exact searches work and special characters are not allowed).
Downloading a Slow Query Log
You can download a log that is not larger than 40 MB directly from the console.
To download a log larger than 40 MB, use OBS Browser+.
- Log in to the RDS console.
- Click in the upper left corner and select a region.
- On the Instances page, click the target instance name.
- In the navigation pane, choose Logs and click the Slow Query Logs tab.
- On the Downloads tab page, find the log which is in the Preparation completed state and click Download in the Operation column. Figure 5 Downloading a slow query log

- The system automatically loads the downloading preparation tasks. The loading duration is determined by the log file size and network environment.
- When the log is being prepared for download, the log status is Preparing.
- When the log is ready for download, the log status is Preparation completed.
- If the preparation for download fails, the log status is Abnormal.
Logs in the Preparing or Abnormal status cannot be downloaded.
- The download link is valid for 5 minutes. After the download link expires, a message is displayed indicating that the download link has expired. If you need to redownload the log, click OK.
- The downloaded log file contains only the logs of the primary node or a read replica.
- The system automatically loads the downloading preparation tasks. The loading duration is determined by the log file size and network environment.
- Log in to the RDS console.
- Click in the upper left corner and select a region.
- On the Instances page, click the target instance name.
- In the navigation pane, click Logs. On the Slow Query Logs page, obtain the name of the slow query log file. Figure 6 Downloading a slow query log

- Download OBS Browser+.
- Decompress and install OBS Browser+. Figure 7 Logging in to OBS Browser+

- On the OBS Browser+ download page of any backup of the current instance, obtain the name of an external bucket. Figure 8 Obtaining an external bucket name

- Add an external bucket. Figure 9 Adding an external bucket


If you want to access OBS external buckets across accounts, the access permission is required. For details, see Granting IAM Users Under an Account the Access to a Bucket and Resources in the Bucket.
- Click the name of the external bucket to go to the object list page. In the search box on the right, search for the log file name obtained in 4 and click
 to download the log file. Figure 10 Downloading a log file

The downloaded log file contains only the logs of the primary node or a read replica.
Configuring Slow Query Log Ingestion to LTS and Showing the Analysis View
- Log in to the RDS console.
- Click in the upper left corner and select a region.
- On the Instances page, click the target instance name to go to the Summary page.
- In the navigation pane, choose Logs and click the Slow Query Logs tab.
- Click Ingest Logs to LTS in the upper right corner of the page.
- In the displayed dialog box, select Ingest Logs to LTS, select Slow logs under Log Types, select a log group and log stream, and click OK. Figure 11 Configuring slow query log ingestion to LTS

- If slow query log ingestion to LTS is enabled, you can switch to the analysis view in the upper right corner of the page to see more details. Figure 12 List view
 Figure 13 Analysis view

- On the Log Search tab page, you can view structured fields and index configuration fields under Quick Analysis as well as view and download log contents. For more information, see Searching and Analyzing Logs.
For explanations of the fields on the Raw Logs page in the analysis view, see Table 4.
Table 4 LTS slow query log fields Parameter
Description
log_type
Log type. Fixed value: slow_log.
instance_id
Instance ID.
node_id
Node ID within an instance.
_resource_id
Resource ID. Fixed value: DBS_LOG. Ignore this parameter.
_resource_name
Resource name. Fixed value: DBS_LOG. Ignore this parameter.
_service_type
Service type. Fixed value: DBS.
service_name
Service name. Fixed value: MYSQL.
rows_examined
Number of data rows that are actually accessed and processed during the SQL execution.
operate_type
Type of the executed SQL statement, for example, SELECT, INSERT, UPDATE, DELETE, CREATE, CALL, ALTER, TRUNCATE, RENAME, FLUSH, EXPLAIN, LOCK, GRANT, REVOKE, COMMIT, ROLLBACK, DROP, or WITH.
count
Number of current SQL statements. Fixed value: 1.
killed
Execution status of a SQL statement. If the execution status is displayed as 0, execution of the SQL statement is properly completed. However, if the SQL statement is forcibly terminated, its execution status is not 0.
The execution status is left blank if the version is 5.7.23 or earlier, 5.6.41 or earlier, or if log_slow_extra is disabled.
- 0: The SQL statement execution is successful.
- 1: Data is corrupted.
- 1053: The server is disconnected.
- 1317: The SQL statement execution is interrupted.
- 3024: The SQL statement execution times out.
log_time
Timestamp (in seconds) when the slow SQL statement started execution.
lock_time
Time spent waiting for locks (in seconds), including both table-level and row-level lock waits.
start_time
UTC time when the slow SQL statement started execution.
rows_sent
Only SELECT statements return the number of result rows (column Result Rows). The number of result rows for the INSERT, UPDATE, DELETE, and CREATE statements is 0 by default.
database
Database where the SQL statement is executed on.
command_text
SQL statements whose execution time exceeds the current slow query threshold.
host
Host used to connect to the database. The value is localhost for local login.
user
Account that executed the SQL statement.
query_time
Duration of the slow SQL query, in seconds.
project_id
Project ID. You can view it by hovering over the username in the upper right corner and choosing My Credentials from the drop-down list.
- On the Charts tab page, you can view scenario-specific data in multiple chart types, including tables, bar charts, and line charts. For more information, see Statistical Charts.
- On the Log Analysis tab page, you can search for and analyze collected log data. For more information, see Log Search and Analysis.
- On the Real-Time Logs tab page, you can view logs reported in real time to quickly search for and analyze log data. For more information, see Viewing Real-Time Logs.
- On the Log Search tab page, you can view structured fields and index configuration fields under Quick Analysis as well as view and download log contents. For more information, see Searching and Analyzing Logs.
FAQ
What is your overall rating for this page?
Thank you very much for your feedback. We will continue working to improve the documentation.See the reply and handling status in My Cloud VOC.
For any further questions, feel free to contact us through the chatbot.
Chatbot


