
Workload Scaling Rules
| Item | HPA | CronHPA | CustomedHPA | VPA | AHPA |
|---|---|---|---|---|---|
| Introduction | Enhanced based on HPA, CronHPA is mainly used if the resource usage of applications changes periodically. | Enhanced CCE auto scaling that is triggered based on metrics or at a scheduled time. | Vertical Pod Autoscaler in Kubernetes. | Advanced horizontal pod autoscaling, which scales beforehand based on historical data. | |
| Rule | Scales Deployment pods based on metrics (CPU usage and memory usage). | Scales Deployment pods periodically (daily, weekly, monthly, or yearly at a specific time). | Scales Deployment pods based on metrics (CPU usage and memory usage) or periodically (daily, weekly, monthly, or yearly at a specific time). | Scales resources requested by a workload based on the historical usage of container resources (CPU and memory). | Predicts the resources needed based on the historical usage of container resources (CPU and memory) and automatically scales workload pods beforehand. |
| Enhancement | Adds the application-level cooldown time window and scaling threshold functions based on the Kubernetes HPA. | Compatible with HPA objects, allowing you to use both CronHPA and HPA.
| Metric-based:
Periodic: You can select a specific time point every day, every week, every month, or every year or a period as the trigger time. | Calculates the optimal value by analyzing historical CPU and memory usage and adjusts the requested pod resources accordingly. | Identifies periods of pod scaling and predicts future fluctuations by analyzing historical service metrics. This proactive approach can resolve the issue of delayed scaling in native HPA. |
| Usage |
How HPA Works
HPA is a controller that controls horizontal pod scaling. HPA periodically checks the pod metrics, calculates the number of pods required to meet the target values configured for HPA resources, and then adjusts the value of the replicas field in the target resource object (such as a Deployment).
A prerequisite for auto scaling is that your container running data can be collected, such as number of cluster nodes/pods, and CPU and memory usage of containers. Kubernetes does not have built-in monitoring capabilities, but you can use extensions like Prometheus and Metrics Server to monitor and collect data.
- Prometheus is an open-source monitoring and alerting framework that can collect multiple types of metrics. Prometheus has been a standard monitoring solution of Kubernetes.
- Metrics Server is a cluster-wide aggregator of resource utilization data. Metrics Server collects metrics from the Summary API exposed by kubelet. These metrics are set for core Kubernetes resources, such as pods, nodes, containers, and Services. Metrics Server provides a set of standard APIs for external systems to collect these metrics.
HPA can work with Metrics Server for auto scaling based on CPU and memory usages. It can also work with Prometheus for auto scaling based on custom metrics.
Figure 1 shows how HPA works.

Two core modules of HPA:
- Data Source Monitoring
The community provided only CPU- and memory-based HPA at the early stage. With the popularity of Kubernetes and Prometheus, developers need more custom metrics or monitoring information at the access layer for their own applications, for example, the QPS of the load balancer and the number of online users of the website. In response, the community defines a set of standard metric APIs to provide services externally through these aggregated APIs.
- metrics.k8s.io provides monitoring metrics related to the CPU and memory of pods and nodes.
- custom.metrics.k8s.io provides custom monitoring metrics related to Kubernetes objects.
- external.metrics.k8s.io provides metrics that come from external systems and are irrelevant to any Kubernetes resource metrics.
- Scaling Decision-Making Algorithms
The HPA controller calculates the scaling ratio based on the current metric values and desired metric values using the following formula:
Desired number of pods = Rounded up value of [Number of current pods × (Current metric value/Target value)]
For example, if the current metric value is 200m and the target value is 100m, the desired number of pods will be doubled according to the formula. In practice, pods may be constantly added or reduced. To ensure stability, the HPA controller is optimized from the following aspects:
- Cooldown interval: In v1.11 and earlier versions, Kubernetes introduced the startup parameters horizontal-pod-autoscaler-downscale-stabilization-window and horizontal-pod-autoScaler-upscale-stabilization-window to indicate the cooldown periods after a scale-in and scale-out, respectively, in which scaling operation will not be performed. In versions later than v1.14, the scheduling queue is introduced to store all decision-making suggestions detected within a period of time. Then, the system makes decisions based on all valid decision-making suggestions to minimize changes of the desired number of pods to ensure stability.
- Tolerance: It can be considered as a buffer zone. If the pod number changes can be tolerated, the number of pods remains unchanged.
ratio = Current metric value/Target value
When |ratio – 1.0| ≤ tolerance, scaling will not be performed.
When |ratio – 1.0| > tolerance, the desired value is calculated using the formula mentioned above.
The default value is 0.1 in the current community version.
The HPA performs scaling based on metric thresholds. Common metrics include the CPU and memory usage. You can also set custom metrics, such as the QPS and number of connections, to trigger scaling. However, metric-based scaling brings in latency of minutes generated during data collection, determination, and scaling phases. This latency may cause high CPU usage and slow response. To solve this problem, CCE allows you to configure scheduled policies to scale resources regularly for applications with periodic changes.
How CronHPA Works
CronHPA is a time-based auto scaling mechanism in Kubernetes. It automatically adjusts the number of pods based on preset rules within a specified period.
- User-defined CronHPA CRDs
You can define CronHPA resources by using Kubernetes YAML files. You can specify the time rule, the lower and upper limits of replicas, and other settings in the YAML files.
- CronHPA Controller Monitoring
CronHPA Controller periodically checks the current time and the defined cron expression to determine whether scaling is required.
- Time Matching
If the current time matches the cron expression, CronHPA Controller triggers scaling.
- Replica Quantity Adjustment
CronHPA Controller calls Kubernetes APIs to adjust the number of replicas of a ReplicaSet, Deployment, or StatefulSet.
- Pod Quantity Change
The target controller (for example, the Deployment Controller) creates or deletes pods based on the new number of replicas for auto scaling.
How VPA Works
VPA is an auto scaling mechanism in Kubernetes. It dynamically adjusts the resource requests and limits of pods based on the resource usages of pods. Different from HPA that responds to changes by increasing or decreasing the number of pods, VPA adjusts the resource requests and limits of each pod for more appropriate resource allocation for pods.
VPA runs using the following components:
- VPA Recommender: uses historical data to suggest how to modify the resources allocated to a pod.
- VPA Updater: checks whether the suggested value is the same as the current value. If they are different, it will rebuild the pod.
- VPA Admission Controller: adjusts the requested resource volume to match the suggested value during pod rebuilding.

The following describes how VPA works:
- VPA Recommender suggests modifications to the resources allocated to a pod based on historical pod resource usages.
- VPA Updater checks whether the current pod resource values are the same as the suggested values.
- If VPA Updater detects that any current values are different from the suggested values, VPA Updater recreates the pod to adjust the specifications based on the suggested values.
- When a pod is rebuilt, VPA Admission Controller intercepts creation requests and adjusts the resource requests and limits based on the suggested values.
- After the VPA adjustment is complete, the suggested value is used as the resource request value of the pod.
How AHPA Works
AHPA is a more advanced auto scaling policy. It improves the functions and flexibility of the traditional HPA to meet more complex scaling requirements, such as predictive scaling.
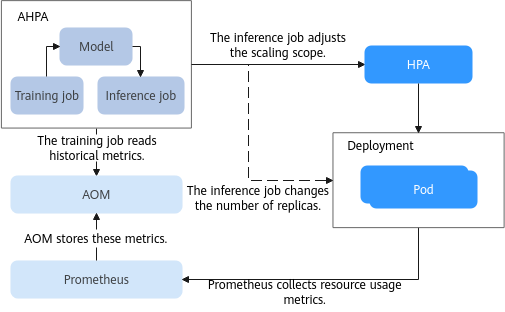
The following shows how AHPA works:
- Prometheus collects resource usage metrics for Deployments and reports these metrics to AOM for storage.
- The training job periodically reads the metrics of each Deployment from AOM, updates the model, and provides the updated model for the inference job.
- The inference job uses the updated model to adjust the HPA scaling scope or the number of Deployment replicas based on model inference. The default adjustment period is 1 minute.
Feedback
Was this page helpful?
Provide feedbackThank you very much for your feedback. We will continue working to improve the documentation.See the reply and handling status in My Cloud VOC.
For any further questions, feel free to contact us through the chatbot.
Chatbot


