Monitoring and Diagnosing a DWS Cluster
Context
DWS offers a multi-dimensional optimization and diagnosis function to enhance self-O&M capability for tenants. It helps identify slow and abnormal SQL statements to ensure the smooth and efficient operation of user services. This allows you to perform historical query diagnosis analysis, real-time query analysis, real-time session analysis, and table diagnosis analysis on clusters.
- Historical Query Analysis: offers the ability to diagnose exceptions by monitoring the top SQL statements in the historical data. It presents SQL trend statistics and analysis curves that showcase the historical execution trend of SQL statements. It identifies top SQL exceptions, detects slow SQL statements that consume significant resources and have long execution times, and displays the count of abnormal SQL statements for each type. It also filters out these abnormal SQL statements. Additionally, it provides a one-click diagnosis for individual SQL statements, including checking the statement, diagnosing the execution plan, and visualizing the results. This assists users in analyzing the execution plans and performance impact of their SQL statements.
- Real-Time Query Analysis: provides analysis of real-time resource consumption and query plans, including information on concurrency and user distribution, lock waiting jobs, slow SQL statements, SQL queues, service concurrency trend chart, real-time queries, and real-time data aggregation.
- Real-Time Session Analysis: provides analysis of real-time session query details, including the number of all sessions, user distribution, idle sessions, active sessions, the number of jobs in the CCN queue, session quantity trend chart, real-time sessions, and real-time data aggregation.
- Tablespace Diagnostics: monitors cluster table metrics. The cluster on the tenant side gathers metric data on a daily basis. This data includes information such as table name, database name, schema name, table size, dirty page rate, skew rate, data volume, index size, distribution mode, number of partitions, compression level, and distribution column. It also identifies and diagnoses tables with improper design based on existing development rules, and offers optimization suggestions.

- This feature is supported only by clusters of version 8.1.3 or later.
- The real-time query monitoring function is disabled by default. To enable it, choose Settings > Monitoring, click Monitoring Collection, and enable Real-Time Query Monitoring. For details, see Viewing Real-Time SQL Records of DWS. Exercise caution when enabling this as it may generate a large amount of data.
- The historical query monitoring function is disabled by default. To enable it, choose Settings > Monitoring, click Monitoring Collection, and enable Historical Query Monitoring. For details, see Viewing Historical SQL Records of DWS. Exercise caution when enabling this as it may generate a large amount of data.
- Tablespace diagnostics is disabled by default. To enable it, contact technical support.
Accessing the Optimization Diagnosis Page
- Log in to the DWS console.
- Choose Monitoring > Optimization Diagnosis on the navigation pane.
- Select the cluster to be optimized from the drop-down list in the upper left corner of the page. Click Historical query analysis, Real-time query analysis, and Real-time session analysis as needed.
- Toggle on Hide System Query in the upper right corner to hide the system user queries.
- To automatically refresh data, toggle on Auto Refresh in the upper right corner. You can also set the desired refresh interval by specifying Refresh Interval (s) for the data to update at regular intervals.
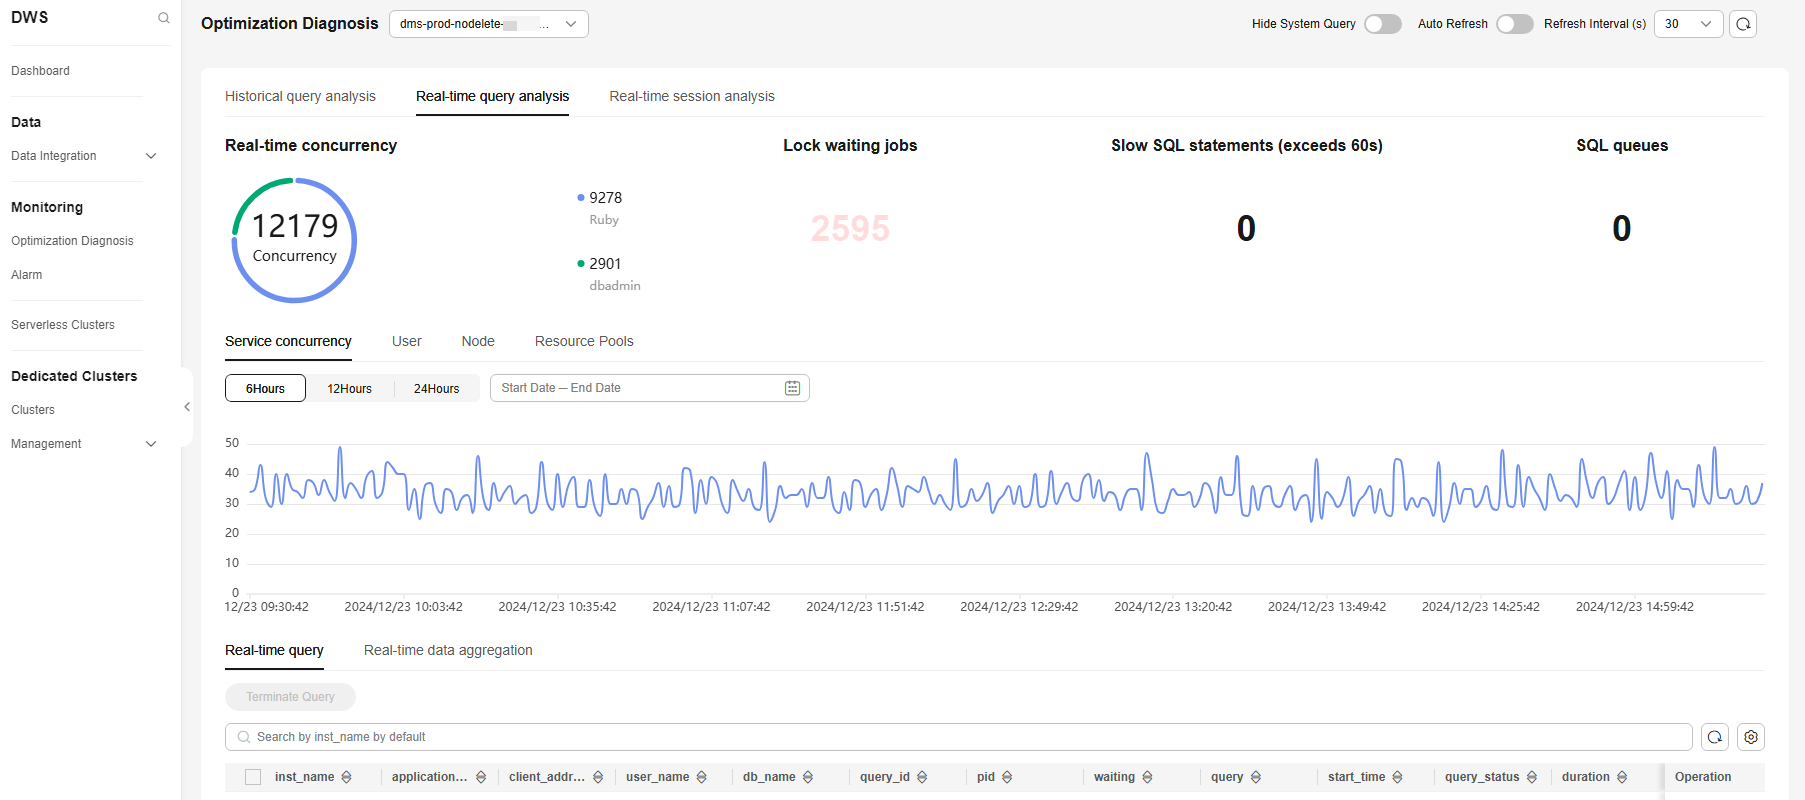
Figure 1 Optimization Diagnosis page
Historical Query Analysis
This Historical query analysis page contains three tab pages: General trend of historical queries, SQL quality trends, and SQL runtime trends. On this page, you can find an overview of SQL quality, detailed information about the top historical SQL queries, perform one-click diagnosis of the execution plan and SQL statements for the top historical SQL statements, and get a summary of historical data.
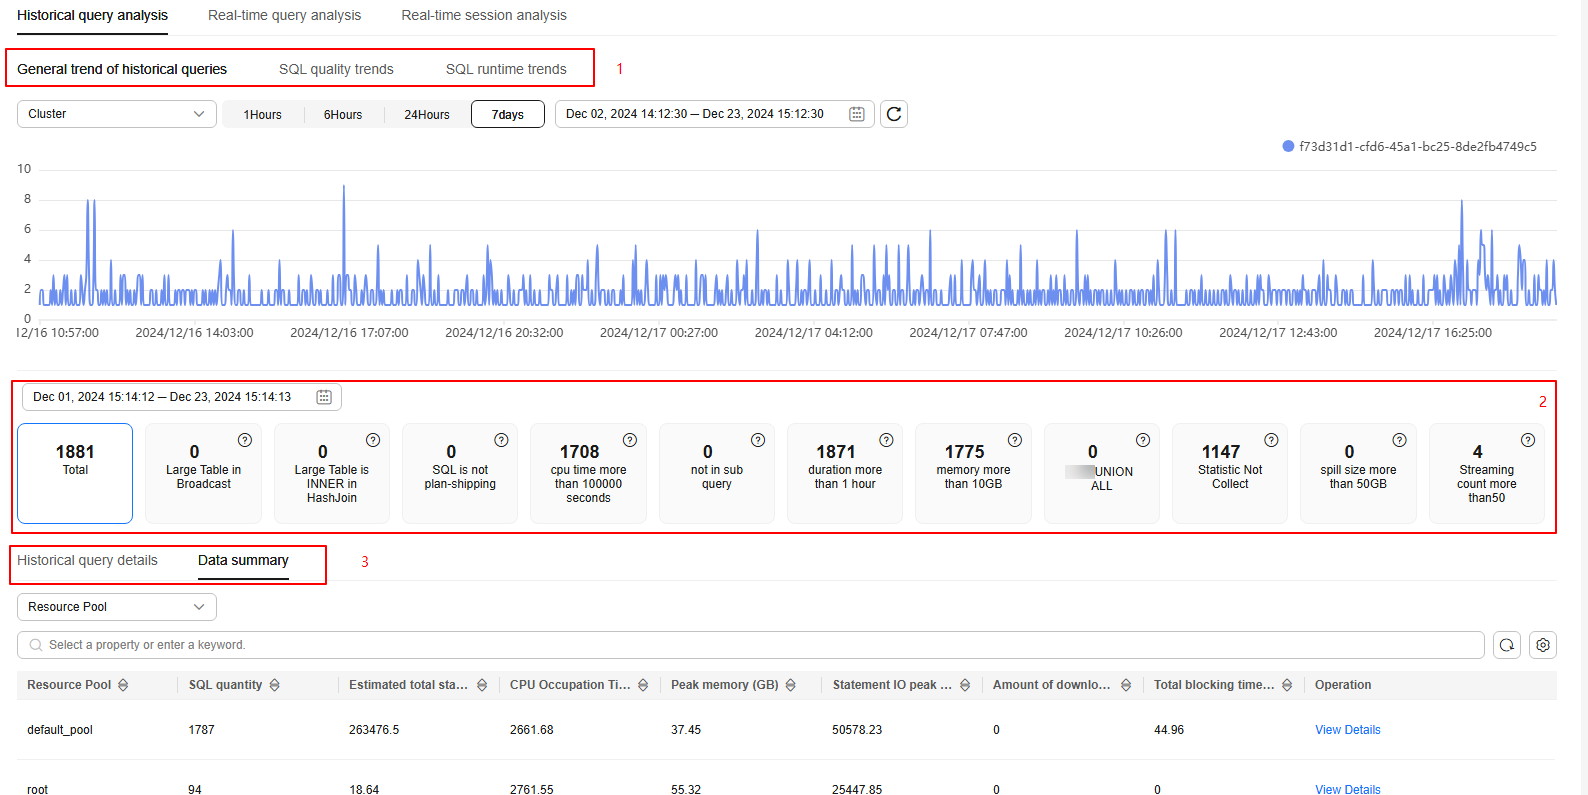
- General trend of historical queries: displays aggregated statistics by different dimensions (cluster, user, instance, application name, and resource pool). You can also check the number of SQL statements executed per minute within a specified period on this tab page.
- SQL quality trends: collects statistics on the number of SQL statements of each exception type within a specified time range.
- SQL runtime trends: collects statistics on the historical SQL execution duration (minimum, average, and maximum durations) of a cluster.
- SQL statement performance overview: displays the number of abnormal SQL statements of each type. You can click different cards to filter the exception types.
Exception types include execution plan pushdown failures, CPU usage exceeding 100,000 seconds, the presence of NOT IN subqueries, query duration exceeding 1 hour, memory usage exceeding 10 GB, disk space usage exceeding 50 GB, and the number of streaming tasks exceeding 50.

For how to customize exception thresholds for different cluster, contact technical support. Exception diagnosis rules can be flexibly configured based on the historical top SQL fields in a DWS cluster.
- Historical query details: displays the details of all historical queries. You can search by criteria or sort all fields to quickly find desired information. Click the setting button in the upper right corner of the list to display or hide columns.
- View Details: Click View Details in the Operation column of the row that contains the target top SQL statement to view its details, including the basic information, real-time resource consumption during execution, complete SQL statement, and query plan.
- One-click diagnosis: Click One-click diagnosis in the Operation column of the row that contains the target top SQL statement to view its static check and execution plan diagnosis result and visualize the result.
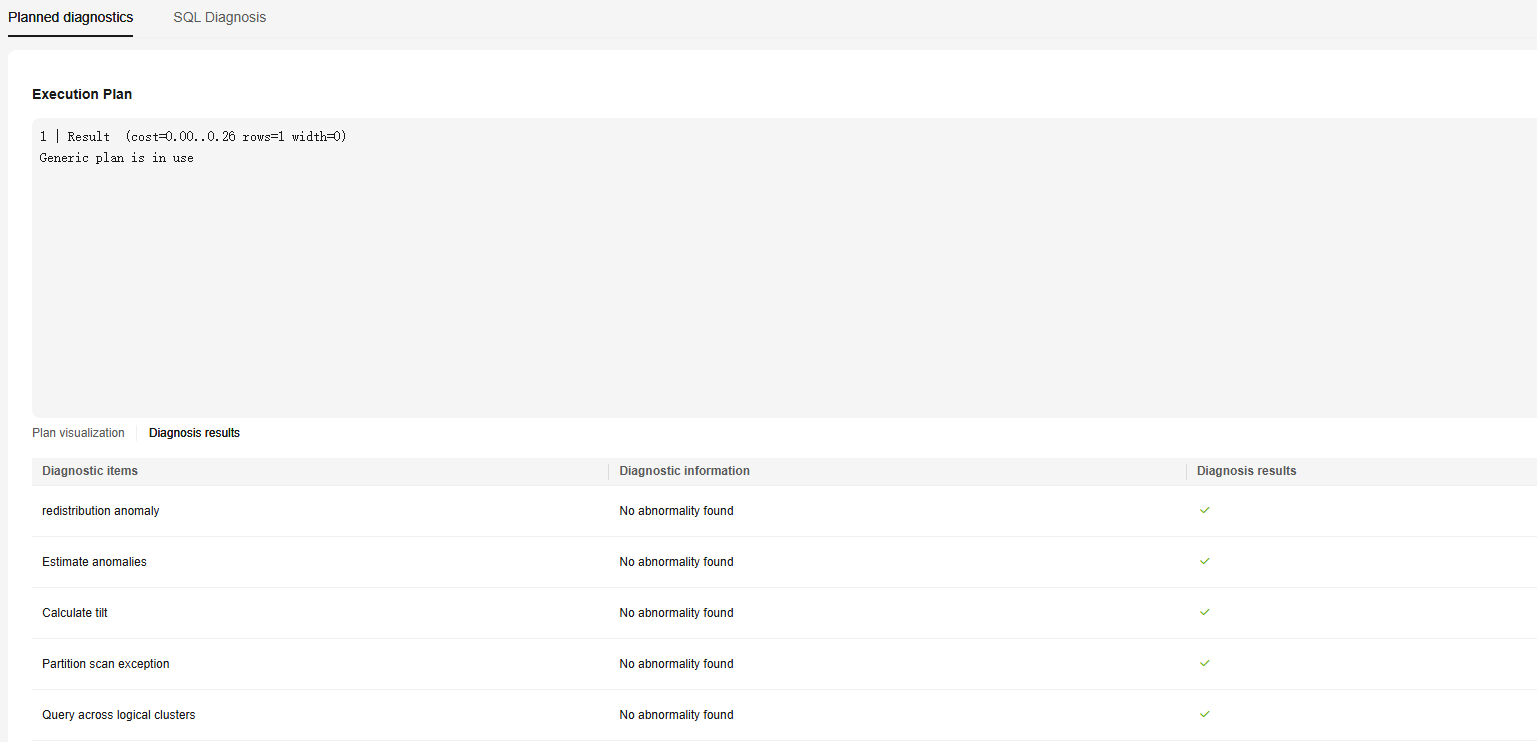
- Planned diagnostics: parses the execution plan character string based on the execution plan format and diagnoses the execution plan in the historical top SQL tables. A visualized tree chart is used to display information about each node, such as the execution duration, type, and number of scanned rows.
The exception types that can be identified include redistribution exceptions, estimation exceptions, computing skews, partition scanning exceptions, and cross-logical cluster queries.

To check the execution duration of each step in the execution plan, set resource_track_level to perf.
Figure 3 Plan visualization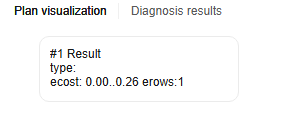 Figure 4 Plan diagnosis
- SQL Diagnosis: performs a static check on user-written SQL statements based on DWS SQL development specifications. It analyzes non-compliant SQL statements and provides rectification suggestions.

The SQL development specifications are formulated based on the usage of DWS. They are for reference only and need to be iterated based on usage. For details, see Overview.
Figure 5 SQL check results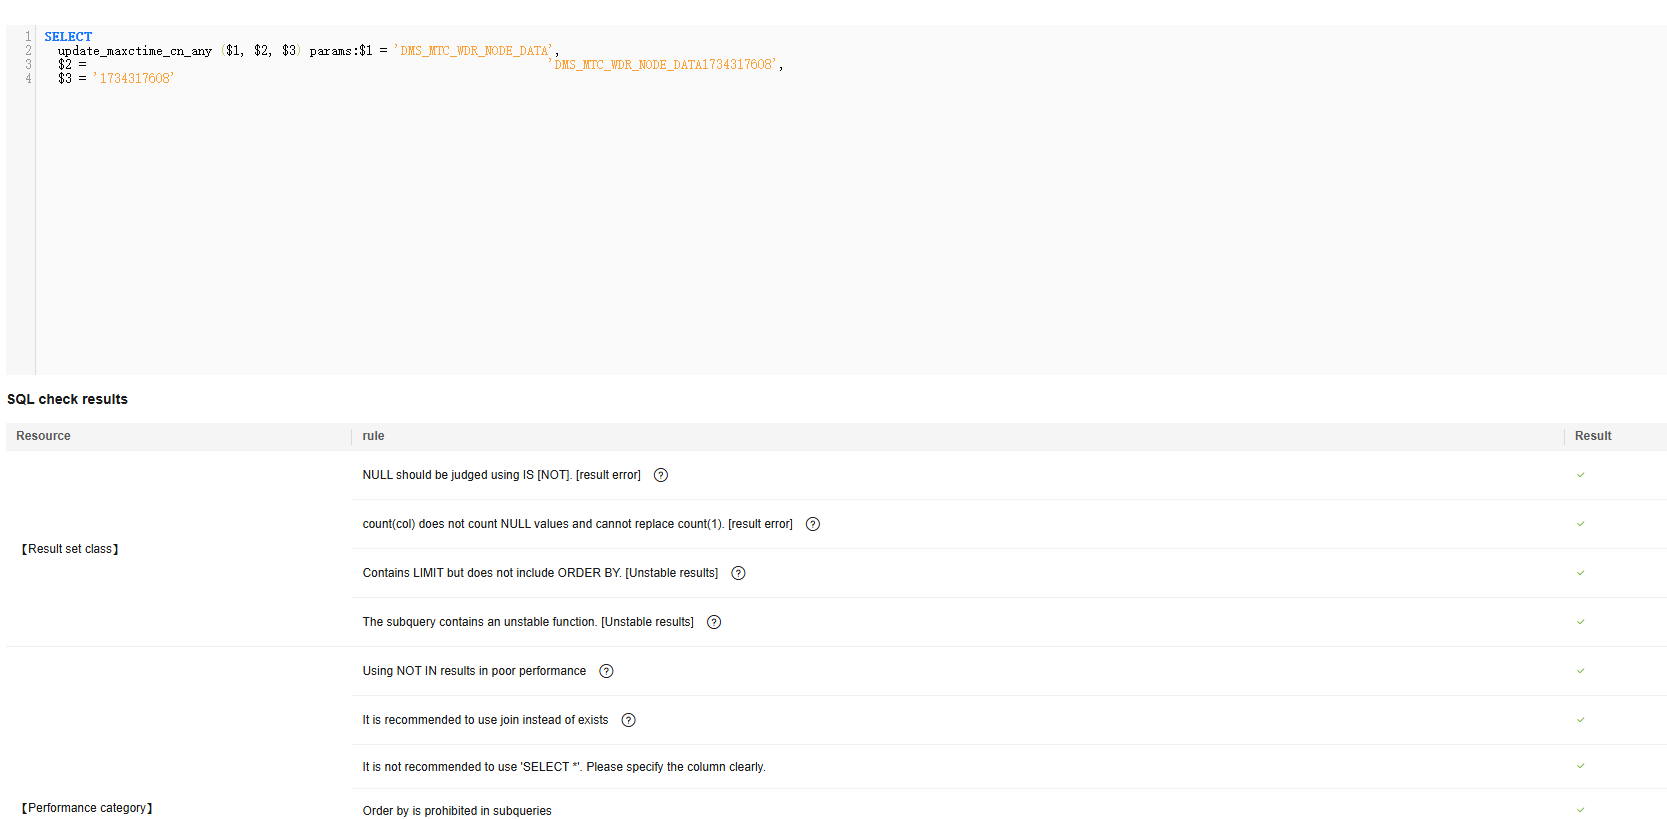
- Planned diagnostics: parses the execution plan character string based on the execution plan format and diagnoses the execution plan in the historical top SQL tables. A visualized tree chart is used to display information about each node, such as the execution duration, type, and number of scanned rows.
- Data summary: aggregates historical top SQL data by various dimensions (database, user, resource pool, application name, instance, and unique SQL ID) and displays the number of SQL statements and their resource consumption.
Click View Details to view the resource consumption details of a particular object.
Real-Time Query Analysis
This page provides information on real-time concurrency and user distribution, lock waiting jobs, slow SQL statements, SQL queues, service concurrency trend chart, real-time queries, and real-time data aggregation.
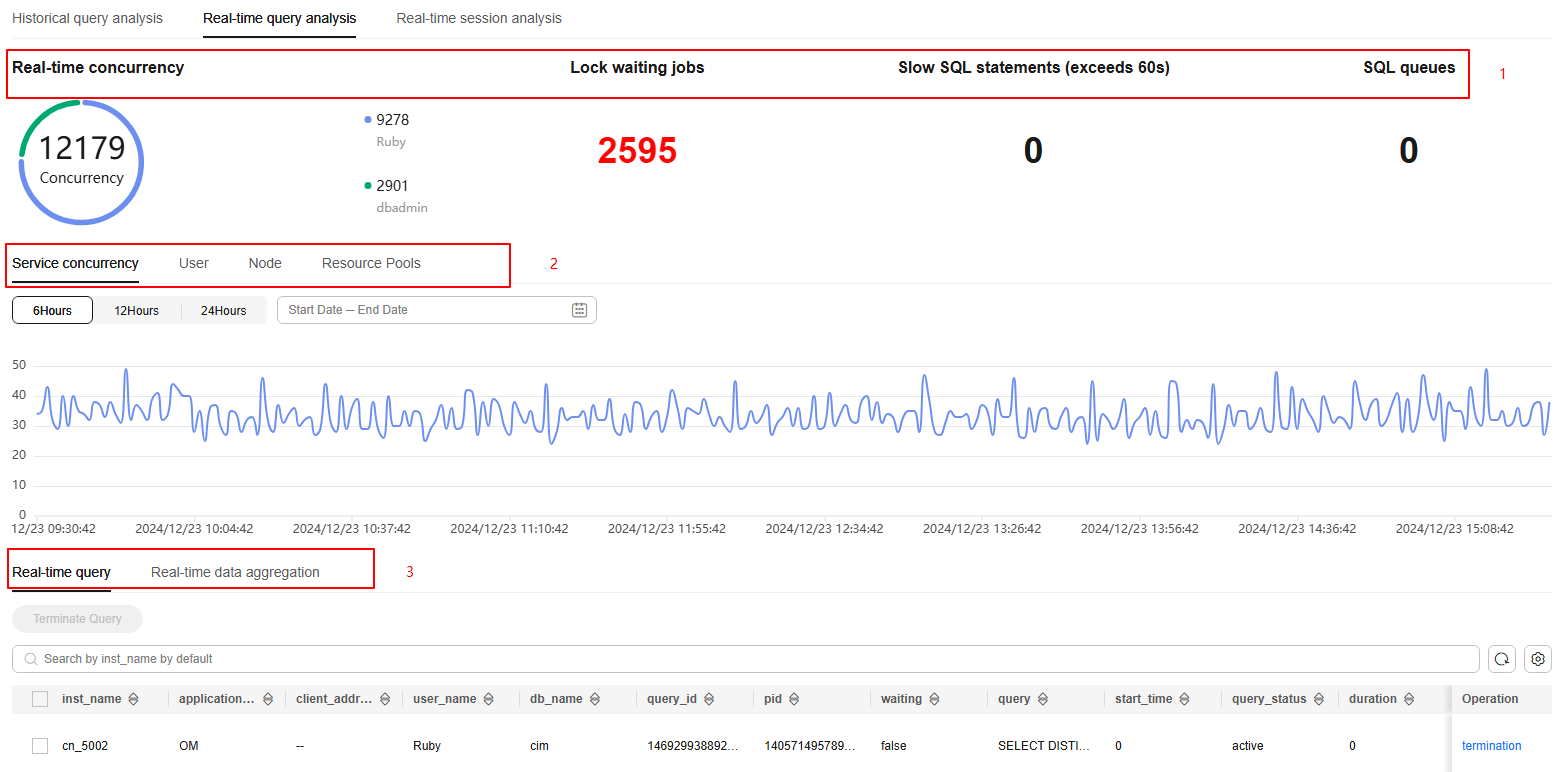
- Real-time Concurrency: displays the number of SQL statements currently running in the cluster and the concurrency distribution for each user.
- Lock waiting jobs: indicates the number of SQL statements waiting for locks in the cluster.
- Slow SQL statements: displays the number of SQL statements whose duration exceeds 60s.
- SQL queues: displays the total number of all queuing SQL statements in the clusters, resource pools, and CCNs.
- Service concurrency: refers to the number of services running concurrently in a cluster during a specific time period. This information is displayed in a line chart, making it easier to collect and compare statistics. You can click User, Node, or Resource Pools to view this information in different dimensions.
- Real-time query: allows you to view all the details of running queries in the cluster. You can sort and filter displayed items to help you quickly locate the information you need. Click the setting button in the upper right corner of the list to display or hide columns.
- Click termination in the Operation column to terminate a real-time top SQL query.
- Select multiple real-time top SQL queries and click Terminate Query above the list to terminate them.
- Click Execute Plan in the Operation column to view a visualized tree chart of real-time top SQL execution plans, including the execution duration, type, and number of scanned rows of each node.

The fine-grained permission control function is added. Only users with the operate permission are able to terminate queries. For users with the read-only permission, the Terminate Query button is grayed out.
- Real-time data aggregation: summarizes the top SQL query data in real-time, categorizing it by different dimensions such as node, query ID, user, and resource pool. It provides information on the number of running SQL statements, queuing SQL statements, slow SQL statements, complex statements, lock waiting jobs, and simple statements.
Real-Time Session Analysis
This page displays the number of real-time sessions and their distribution among users, the number of idle and active sessions, the number of jobs in the CCN queue, session quantity trend chart, real-time session list, and real-time data aggregation.
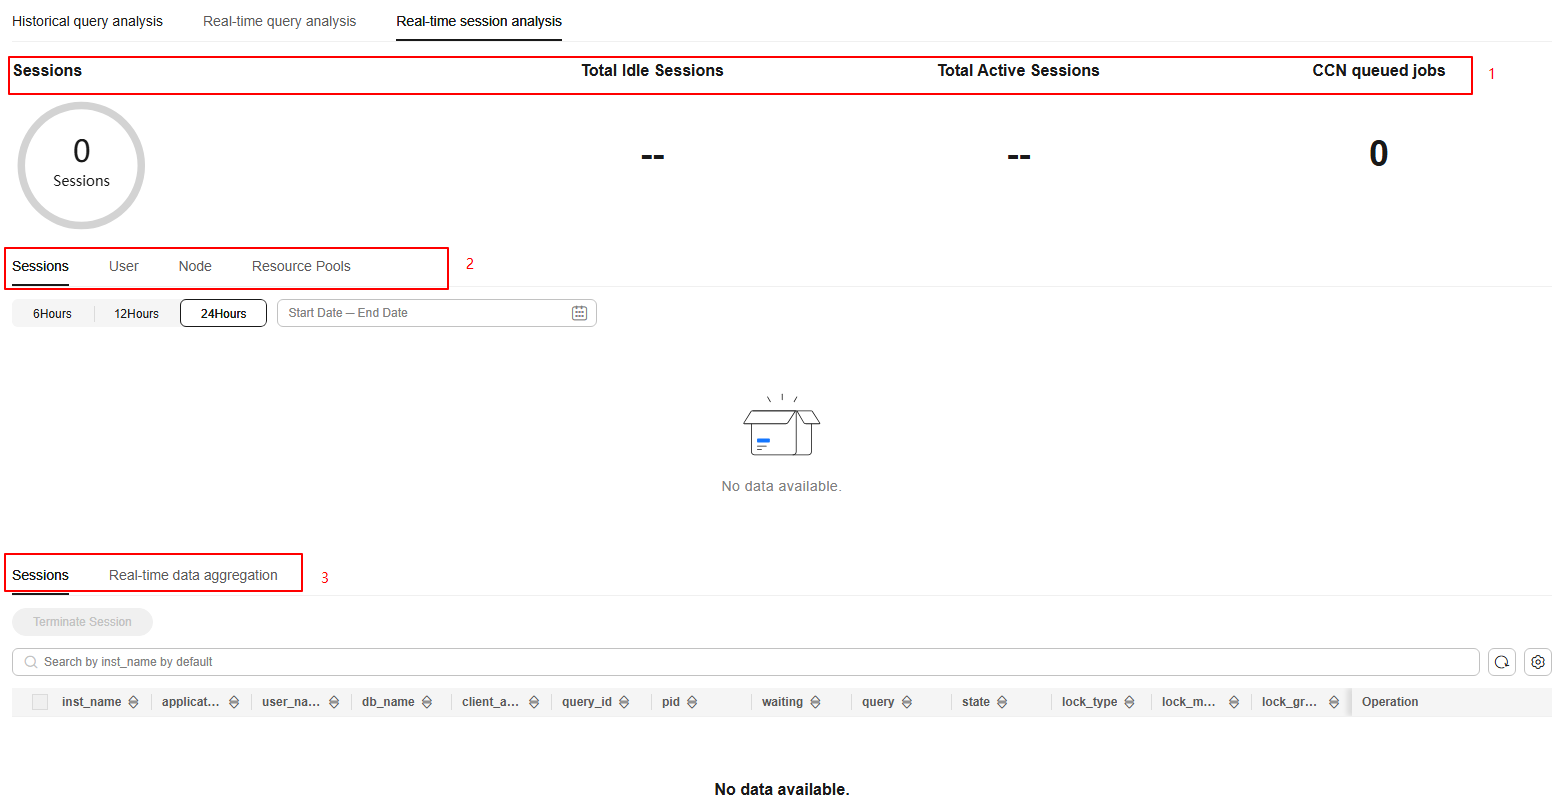
- Sessions: displays the total number of real-time sessions in the cluster and their distribution among users.
- Total Idle Sessions: refers to the total number of idle sessions in the cluster.
- Total Active Sessions: refers to the total number of active sessions in the cluster.
- CCN queued jobs: displays the total number of jobs in the CCN queue.
- Sessions: refers to the number of sessions in a cluster during a specific time period. This information is displayed in a line chart, making it easier to collect and compare statistics. You can click User, Node, or Resource Pools to view this information in different dimensions.
- Sessions: allows you to view the real-time information about all running sessions. You can sort and filter displayed items to help you quickly locate the information you need. Click the setting button in the upper right corner of the list to display or hide columns.
- Click termination in the Operation column to terminate a real-time session.
- Select multiple sessions and click Terminate Session above the list to terminate them.

The fine-grained permission control function is added. Only users with the operate permission are able to terminate sessions. For users with the read-only permission, the Terminate a Session button is grayed out.
- Real-time data aggregation: summarizes session data by various dimensions (node, user, and resource pool) and displays metrics such as the number of active sessions, the number of idle sessions, CPU usage time (s), average memory usage (MB), estimated memory usage (MB), and spilled data volume (MB).
Tablespace Diagnostics
You can check the disk information, schema usage, tablespace trends, table diagnostics overview, and table data details on the page.
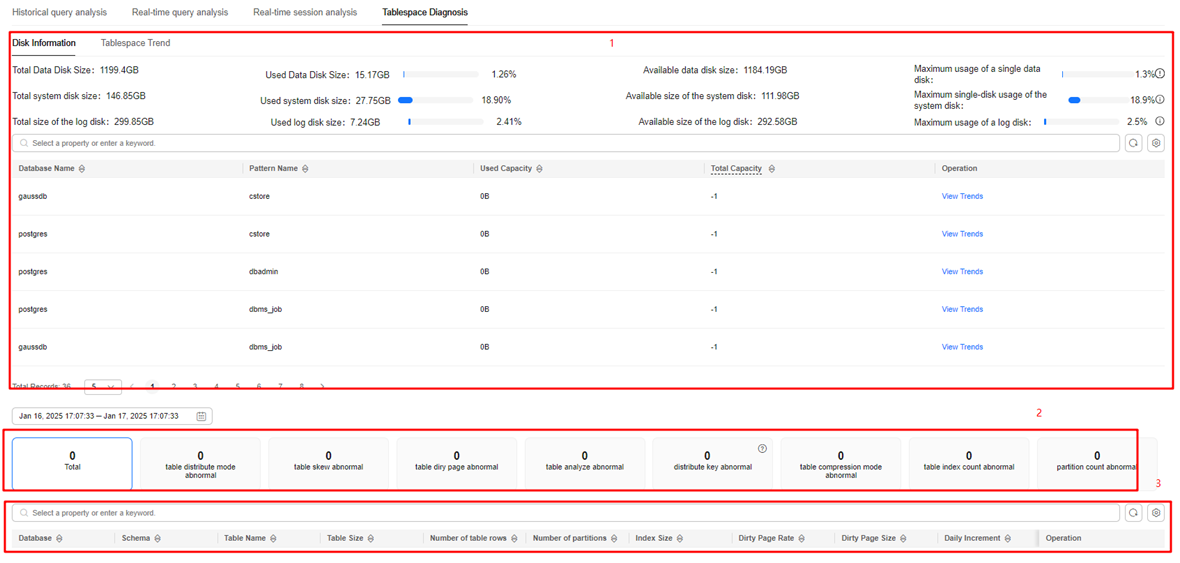
- Disk Information: displays the total size, used size, and available size of the data disk, system disk, and log disk in the current cluster, as well as the maximum usage of a single disk. You can click the icon on the right of the disk usage to display the nodes and disks in use, helping you quickly locate the disk with the highest usage.
- Schema usage: displays the usage of the current cluster mode. You can click View Trends in the Operation column to view the historical trends of the past 7 days, 15 days, or 30 days.
- Tablespace Trend: collects statistics by different dimensions (cluster, database, and schema) and displays the historical curves of the table size, index size, and dirty page size.
- Table diagnostics overview: provides an overview of table diagnosis rules, which include information about abnormal table distribution mode, skew, dirty page, statistics, distribution key, compression mode, number of indexes in a single table, and number of partitions. You can also view the number of abnormal tables of different types. You can click different card to refresh the following table and view the information you need.
- Table Data Details: displays the service table information of the current cluster. It includes important details like the database, schema, table name, size, number of rows, partitions, indexes, index size, dirty page rate, skew rate, daily increment, number of distribution keys, and distribution key details.
- Click Table trend in the Operation column to view the historical curves of the index size, table size, and dirty page size of a specific table.
- Click Table Vacuum in the Operation column to reclaim the VACUUM FULL tablespace of a specified table.
- Click Table Analyze in the Operation column to analyze a specified table.
Feedback
Was this page helpful?
Provide feedbackThank you very much for your feedback. We will continue working to improve the documentation.See the reply and handling status in My Cloud VOC.
For any further questions, feel free to contact us through the chatbot.
Chatbot


