Viewing Node Metrics of a DWS Cluster
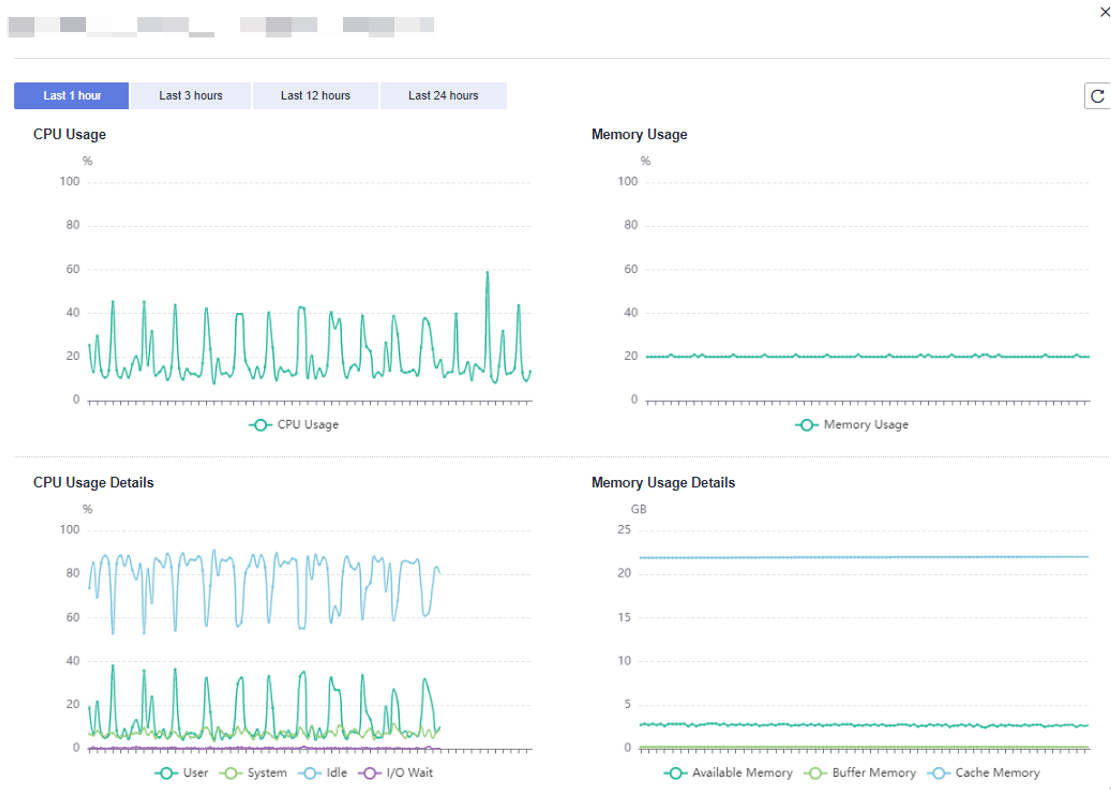
On the node monitoring page, you can view the real-time consumption of nodes, memory, disks, disk I/O, and network I/O.
Node Monitoring
- Log in to the DWS console.
- Choose Dedicated Clusters > Clusters and locate the cluster to be monitored.
- In the Operation column of the target cluster, click Monitoring Panel. The database monitoring page is displayed.
- In the navigation pane on the left, choose Monitoring > Node Monitoring.
Overview
On the Overview tab page, you can view the key resources of a specified node based on the node name. Table 1 Node metrics lists the metrics.

|
Metric Name |
Description |
Monitoring Interval (Raw Data) |
|---|---|---|
|
Node Name |
Name of a cluster node |
180s |
|
CPU Usage (%) |
Ratio of the time taken by tasks on the CPU to the total available time |
60s |
|
Memory Usage (%) |
Ratio of the allocated and used memory to the total memory |
60s |
|
Average Disk Usage (%) |
Ratio of the disk read/write time to the total time in a unit time |
30s |
|
IP Address |
IP address of the node |
180s |
|
Disk I/O (KB/s) |
Total amount of data read from or written to a disk per second |
60s |
|
TCP Protocol Stack Retransmission Rate (%) |
Ratio of the number of times that TCP data packets need to be resent to the total number of times that TCP data packets are sent within a specified period |
60s |
|
Network I/O (KB/s) |
Data volume transmitted through the network per second |
60s |
|
Status |
Node status |
180s |
|
Monitoring |
You can click the button in the Monitoring column to view the overall performance metric topology of the node in the last 1 hour, last 3 hours, last 12 hours, last 24 hours, last 7 days, or last 15 days. |
- |
Disks
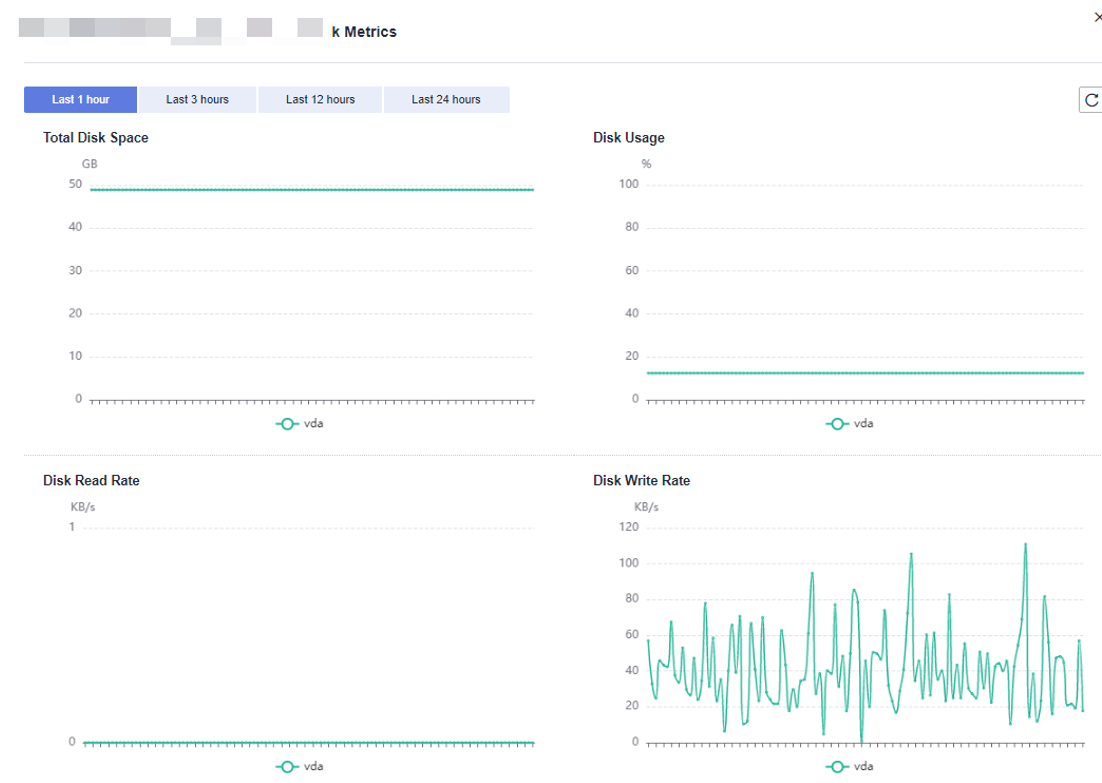
On the Disks tab page, you can view the real-time disk resource consumption of a node by node name and disk name. Table 2 Disk metrics lists the metrics.

|
Metric Name |
Description |
Monitoring Interval (Raw Data) |
|---|---|---|
|
Node Name |
Name of a node in a cluster |
180s |
|
Disk Name |
Disk name |
30s |
|
Disk Type |
The following disk types are supported:
|
30s |
|
Disk Capacity (GB) |
Storage capacity of a disk |
30s |
|
Disk Usage (%) |
Disk usage The sum of the used disk space and available disk space is not equal to the total disk space. This is because a small amount of space is reserved in each default partition for system administrators to use. Even if common users have run out of space, system administrators can log in to the system and use their space required for solving problems. Run the Linux df command to collect the disk capacity information, as shown in the following figure.
/dev/sda4: Used(5757444) + Available(540228616) != Total(569616888)
|
30s |
|
Disk Read Rate (KB/s) |
Rate at which data is read from the device per second |
30s |
|
Disk Write Rate (KB/s) |
Rate at which data is written to the device per second |
30s |
|
I/O Wait Time (await, ms) |
Average waiting time for each I/O request |
60s |
|
I/O Service Time (svctm, ms) |
Average processing time for each I/O request |
60s |
|
IOPS |
Number of input/output operations per second |
60s |
|
Monitoring |
You can click the button in the Monitoring column to view the disk performance metric topology of the node in the last 1 hour, last 3 hours, last 12 hours, last 24 hours, last 7 days, or last 15 days. |
- |
Network
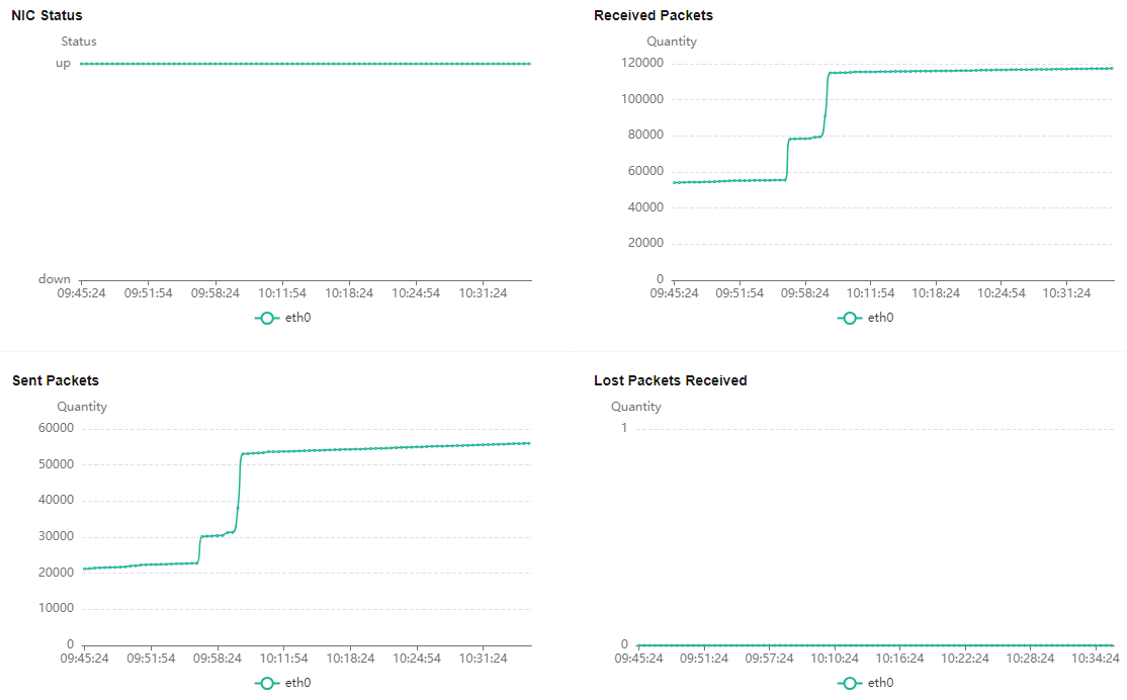
On the Network tab page, you can view the real-time network resource consumption of a node by node name and NIC name. Table 3 Network metrics lists the metrics.

|
Metric Name |
Description |
Monitoring Interval (Raw Data) |
|---|---|---|
|
Node Name |
Name of a cluster node |
180s |
|
NIC Name |
Name of the NIC |
60s |
|
NIC Status |
NIC status (up/down) |
60s |
|
NIC Speed (Mbps) |
NIC speed |
60s |
|
Received Packets |
Number of packets received by the NIC |
60s |
|
Sent Packets |
Number of packets sent by the NIC |
60s |
|
Lost Packets Received |
Number of received data packets that are dropped by the NIC |
60s |
|
Receive Rate (KB/s) |
Rate at which data is received by the NIC |
60s |
|
Transmit Rate (KB/s) |
Rate at which data is sent by the NIC |
60s |
|
Monitoring |
You can click the button in the Monitoring column to view the network performance metric topology of the node in the last 1 hour, last 3 hours, last 12 hours, last 24 hours, last 7 days, or last 15 days. |
- |
Feedback
Was this page helpful?
Provide feedbackThank you very much for your feedback. We will continue working to improve the documentation.See the reply and handling status in My Cloud VOC.
For any further questions, feel free to contact us through the chatbot.
Chatbot


