
Page Datasets
Scenario
Multiple widgets can connect to the same data input through the page dataset, reducing repeated requests and configurations. In addition, when creating a page dataset, you can configure a maximum of 10 data inputs so that the widgets can connect to multiple data flows at the same time.
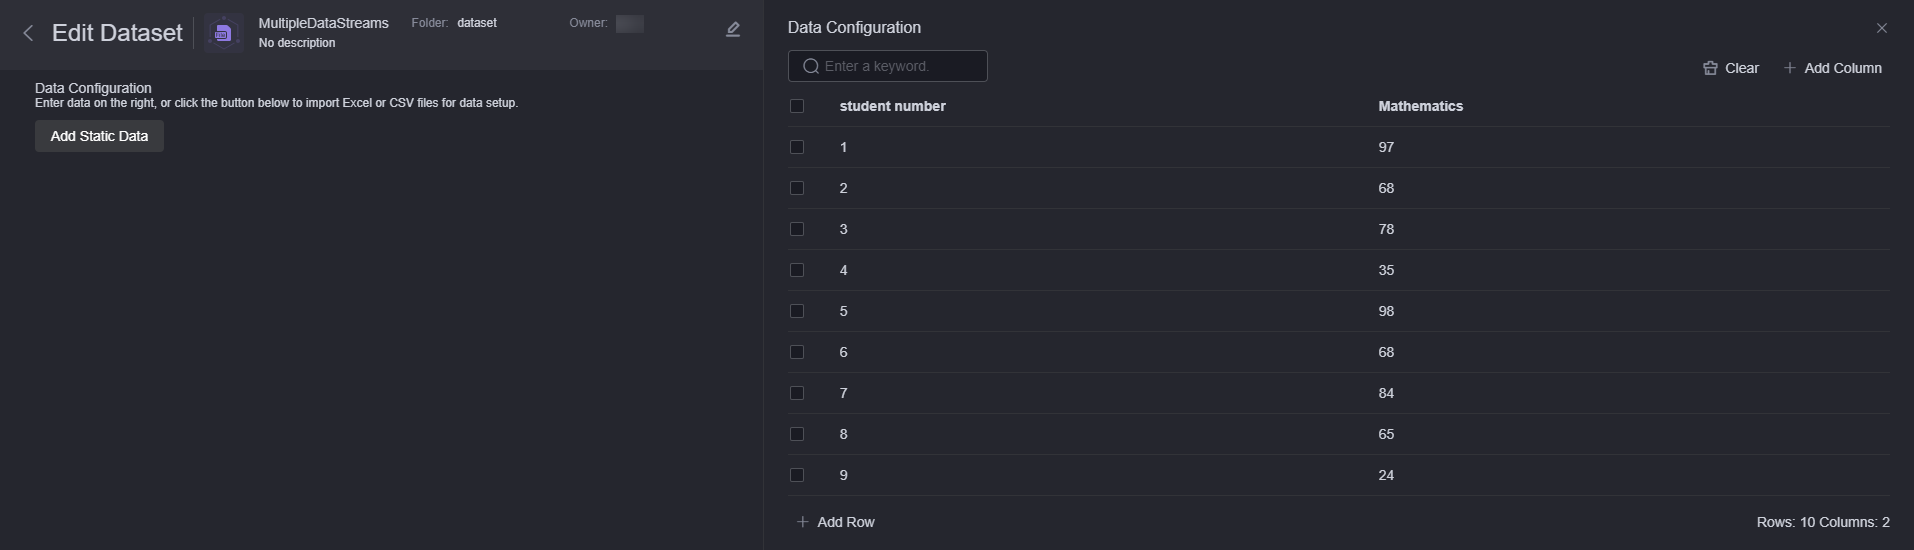
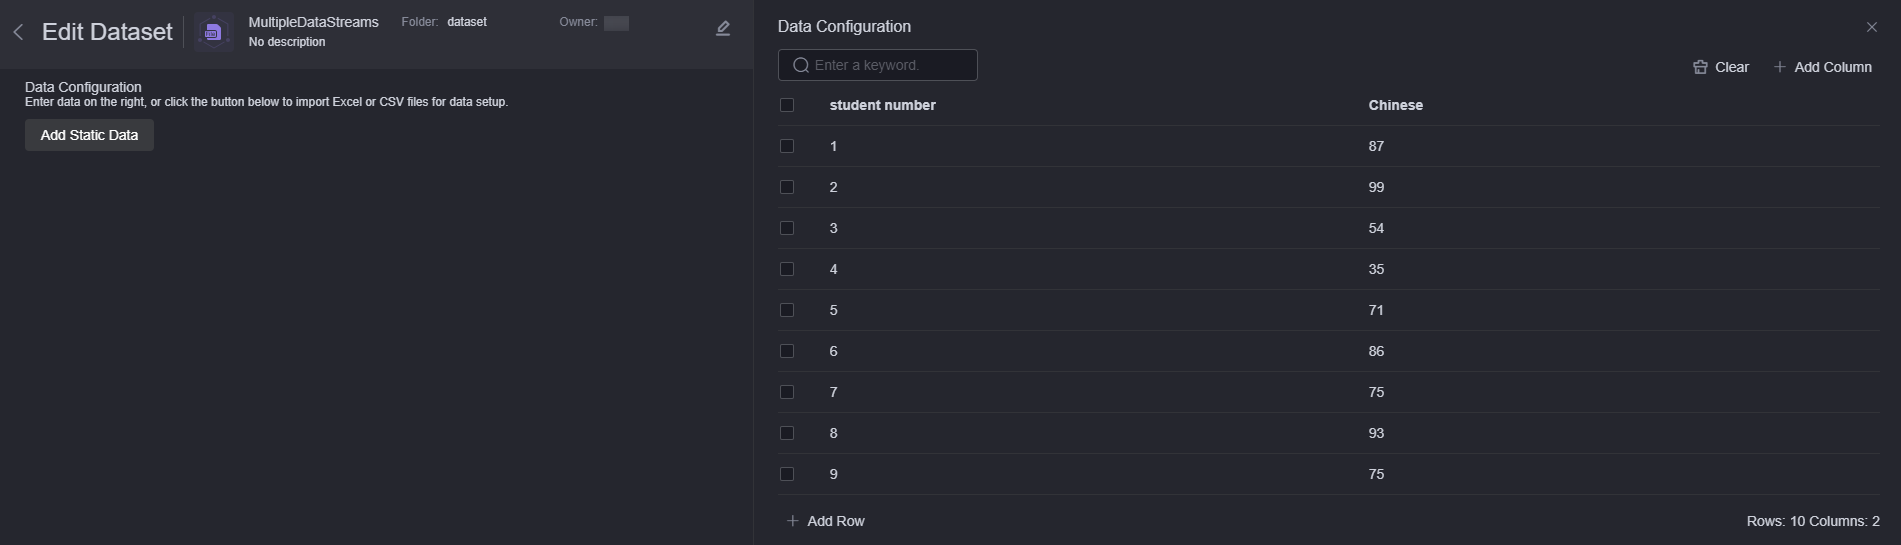
This section describes how to create and use a page dataset by combining data in two static datasets (multi-data stream 1 and multi-data stream 2) as the data source of a widget.
Prerequisites
You have created a dataset of the static data type by referring to Static Data Datasets.
Creating Page Datasets
- Log in to Huawei Cloud Astro Canvas by referring to Logging In to Huawei Cloud Astro Canvas.
- On the editing page, select Data and click +.
- Enter the name of the page dataset and click the confirm button.
Figure 3 Creating page datasets
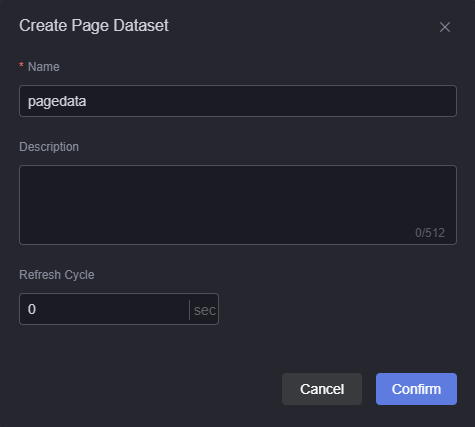
- Page dataset name: The dataset name can contain 1 to 60 characters, including letters, digits, and underscores (_).
- Description: Description of the new dataset, which usually indicates the function or scenario of the dataset. The value can contain 0 to 512 characters.
- Refresh cycle: Interval for obtaining data from the dataset. Default is 0, meaning the data is obtained only once.
- Drag a data input node from the data input area to the canvas on the right and select the created MultiDataStream1 dataset.
Figure 4 Adding a data input node
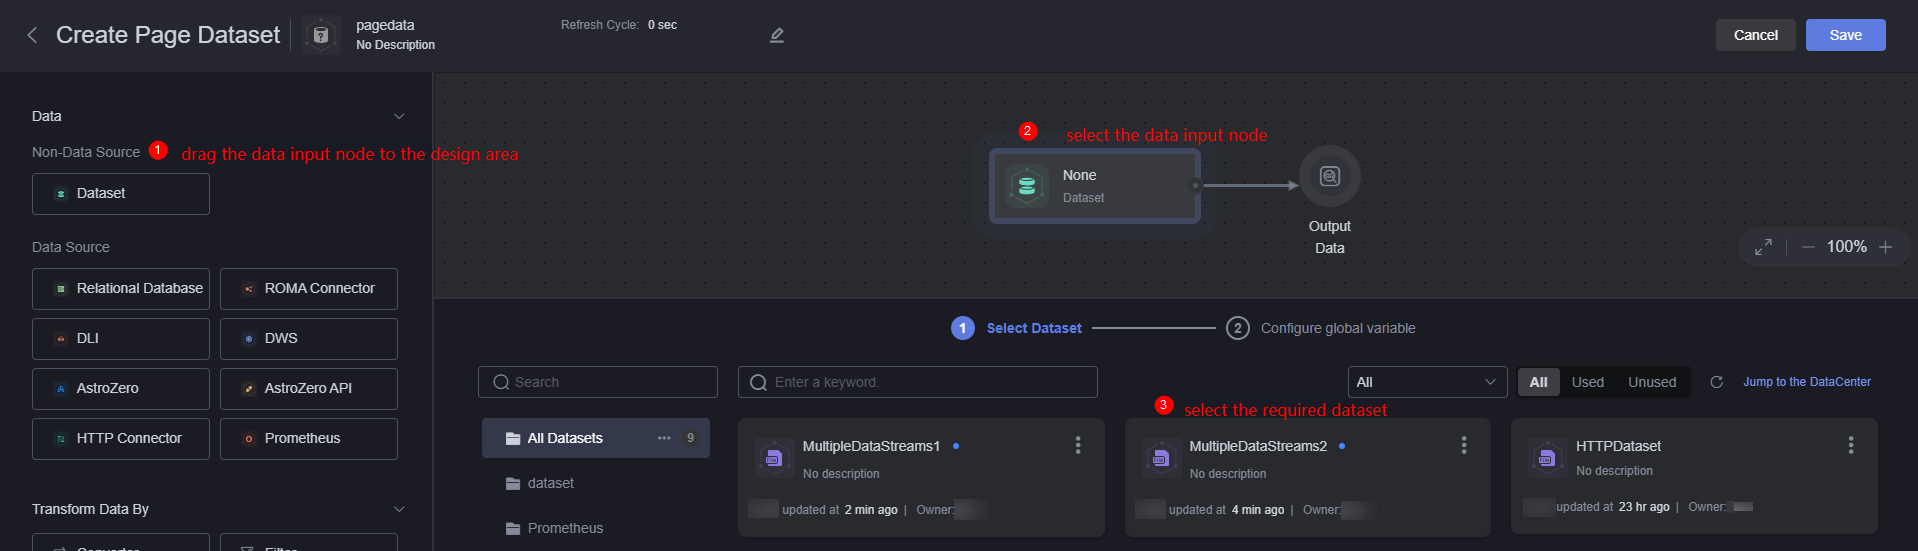 Figure 5 Effect after MultiDataStream1 are added
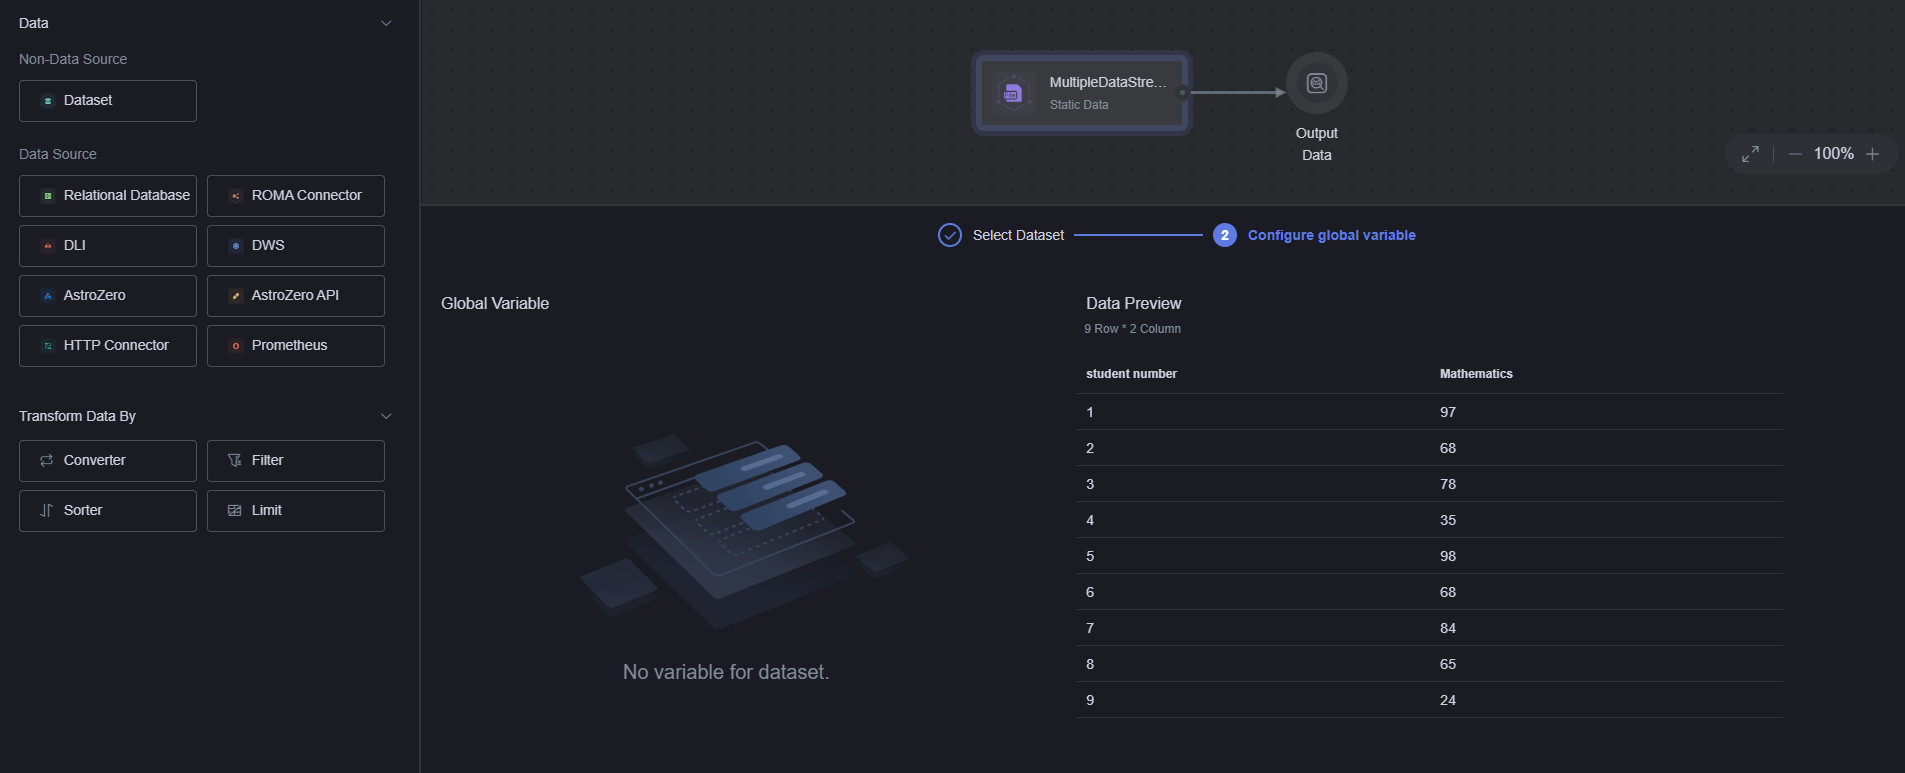
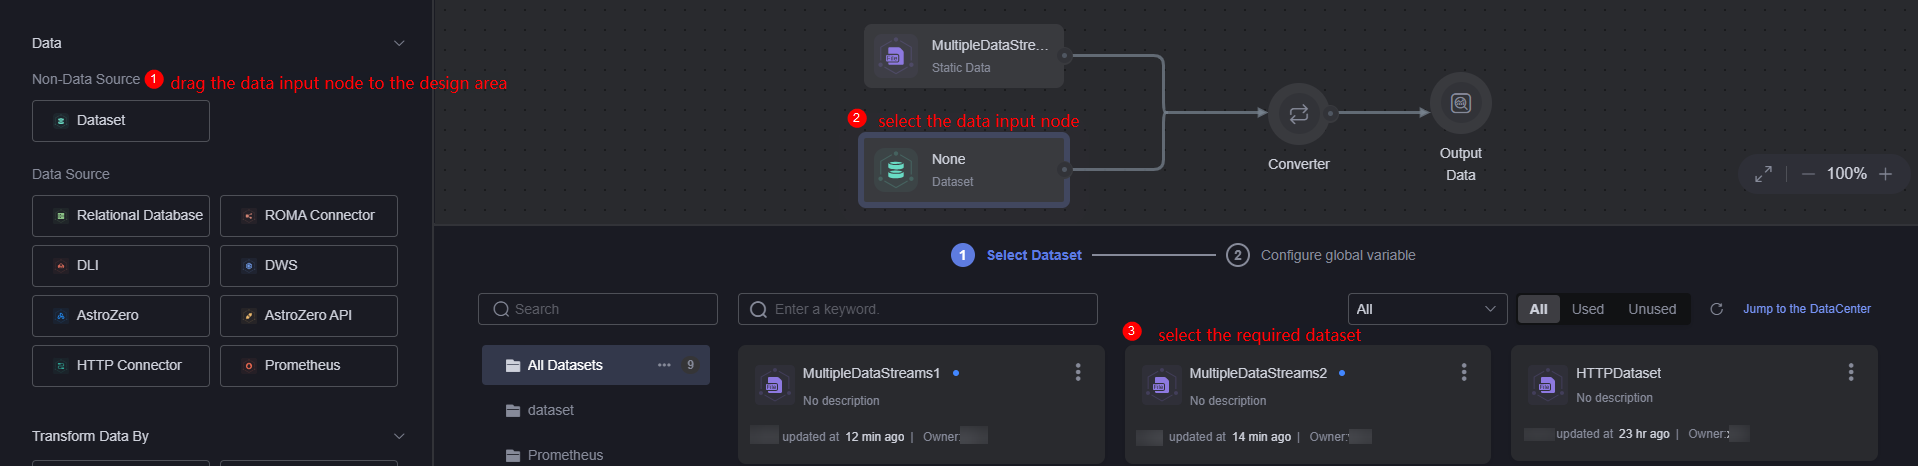
- Drag a data input node from the data input area to the canvas on the right and select the created MultiDataStream2 dataset.
Figure 6 Adding another data input node
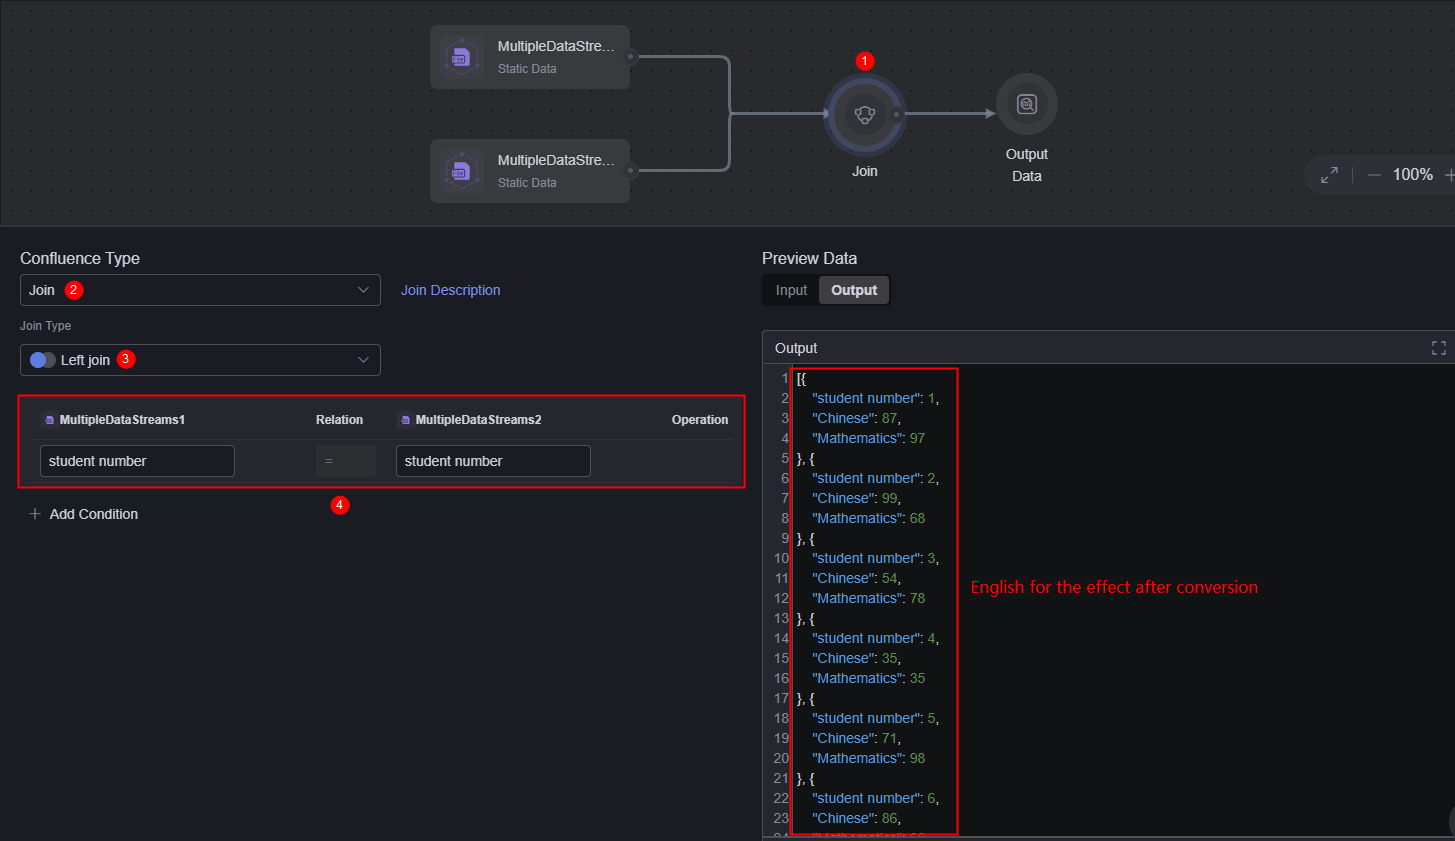
- Select a converter, set Confluence Type to Converter, and add a converter.
You can also set Confluence Type to Join to aggregate data, for example, Figure 8.
- Left join: Returns all rows in the left table. If a row in the left table does not match any row in the right table, null is returned for the column in the right table.
- Right join: Contrary to left join, all rows in the right table are returned. If a row in the right table does not match any row in the left table, null is returned for the column in the left table.
- Inner join: The intersection of two tables is used. Only the intersection of two tables can be displayed.
- Full join: Returns all rows in the left and right tables. If a row does not have a matching row in another table, the column in the other table returns null.
Figure 7 Creating a confluent converter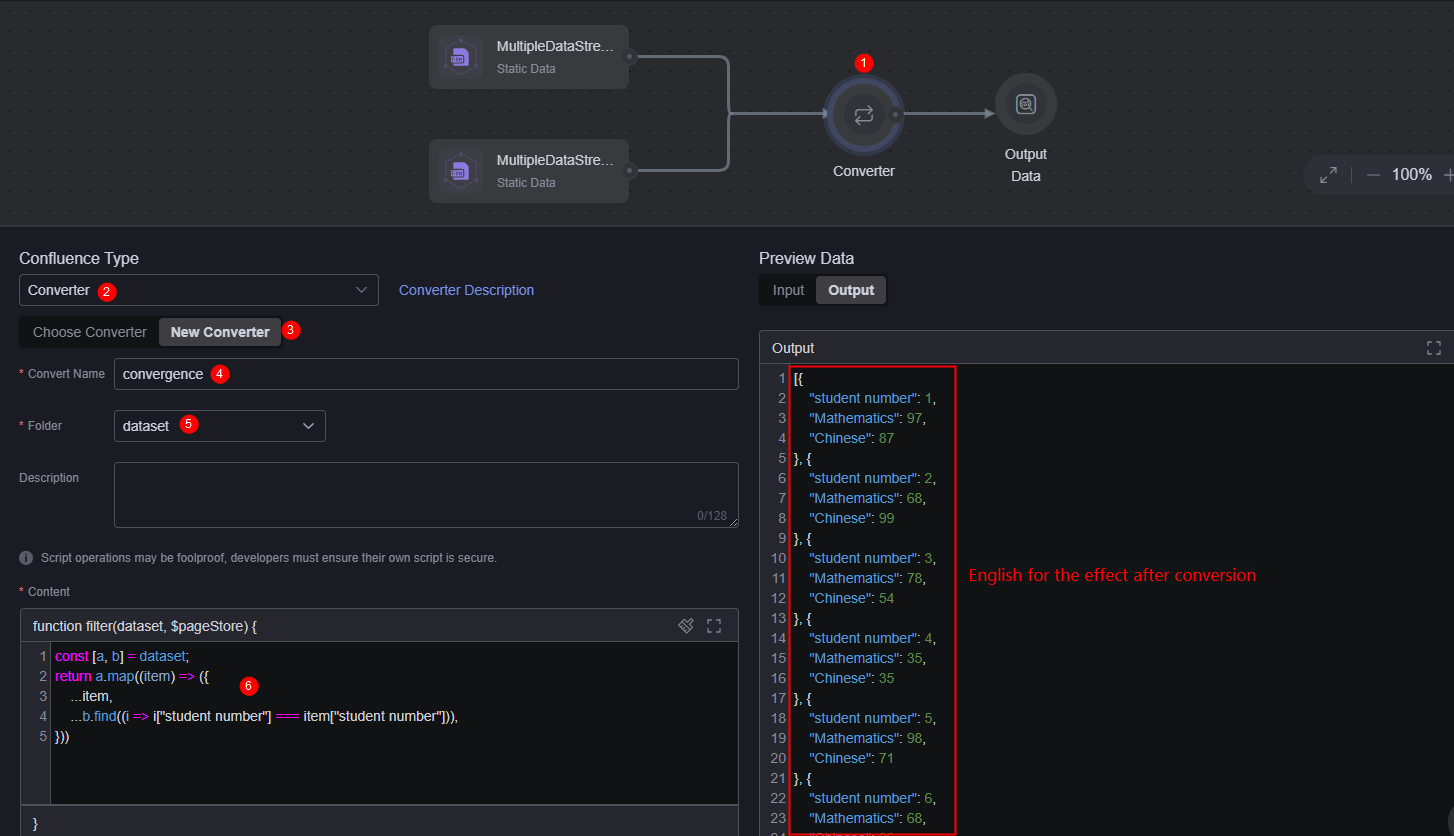
- Converter: Name of the converter to be created. In this example, set this parameter to confluence.
- Folder: Select the folder for storing the converter. In this example, select a preset folder.
- Converter content: Set this parameter as required. In this example, the converter content is as follows, that is, the data in MultiDataStream1 and MultiDataStream2 is summarized.
const [a, b] = dataset;
return a.map((item) => ({
    ...item,
    ...b.find((i => i["Student ID"] === item["Student ID"])),
}))
- After the converter is saved, click the save button in the upper right corner of the page to return to the design page.
On the dataset tab page, you can view the created dataset. Click
 to view the data sources used on the current page.
Figure 9 Viewing the page dataset
to view the data sources used on the current page.
Figure 9 Viewing the page dataset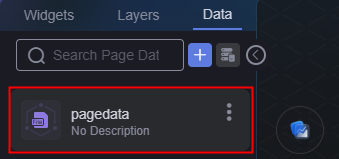
Using Page Datasets
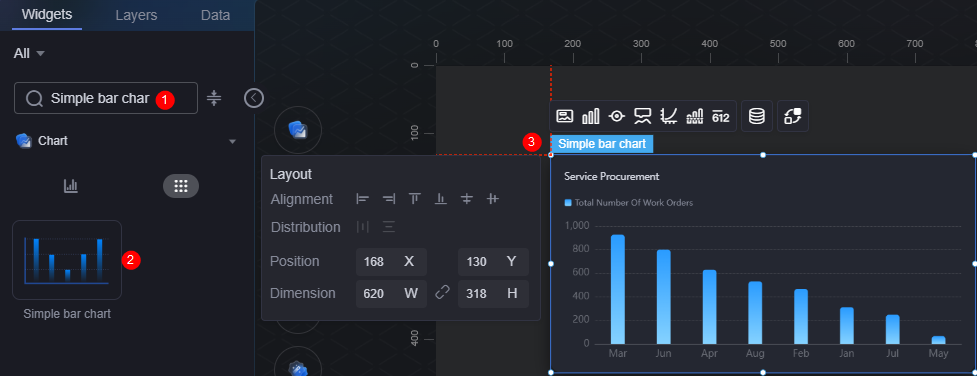
- On the development page and drag a basic bar chart from Widgets > Chart to the canvas.
Figure 10 Dragging a basic bar chart to the canvas
- Select a widget and click
 above the widget. The data source setting page is displayed.
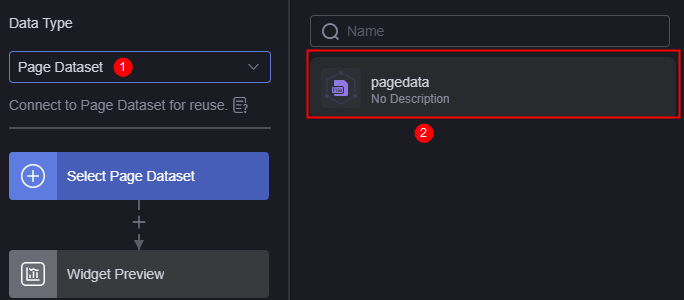
 - Set Data Type to Page Dataset and select the dataset created in Creating Page Datasets.
Figure 11 Selecting Page Dataset
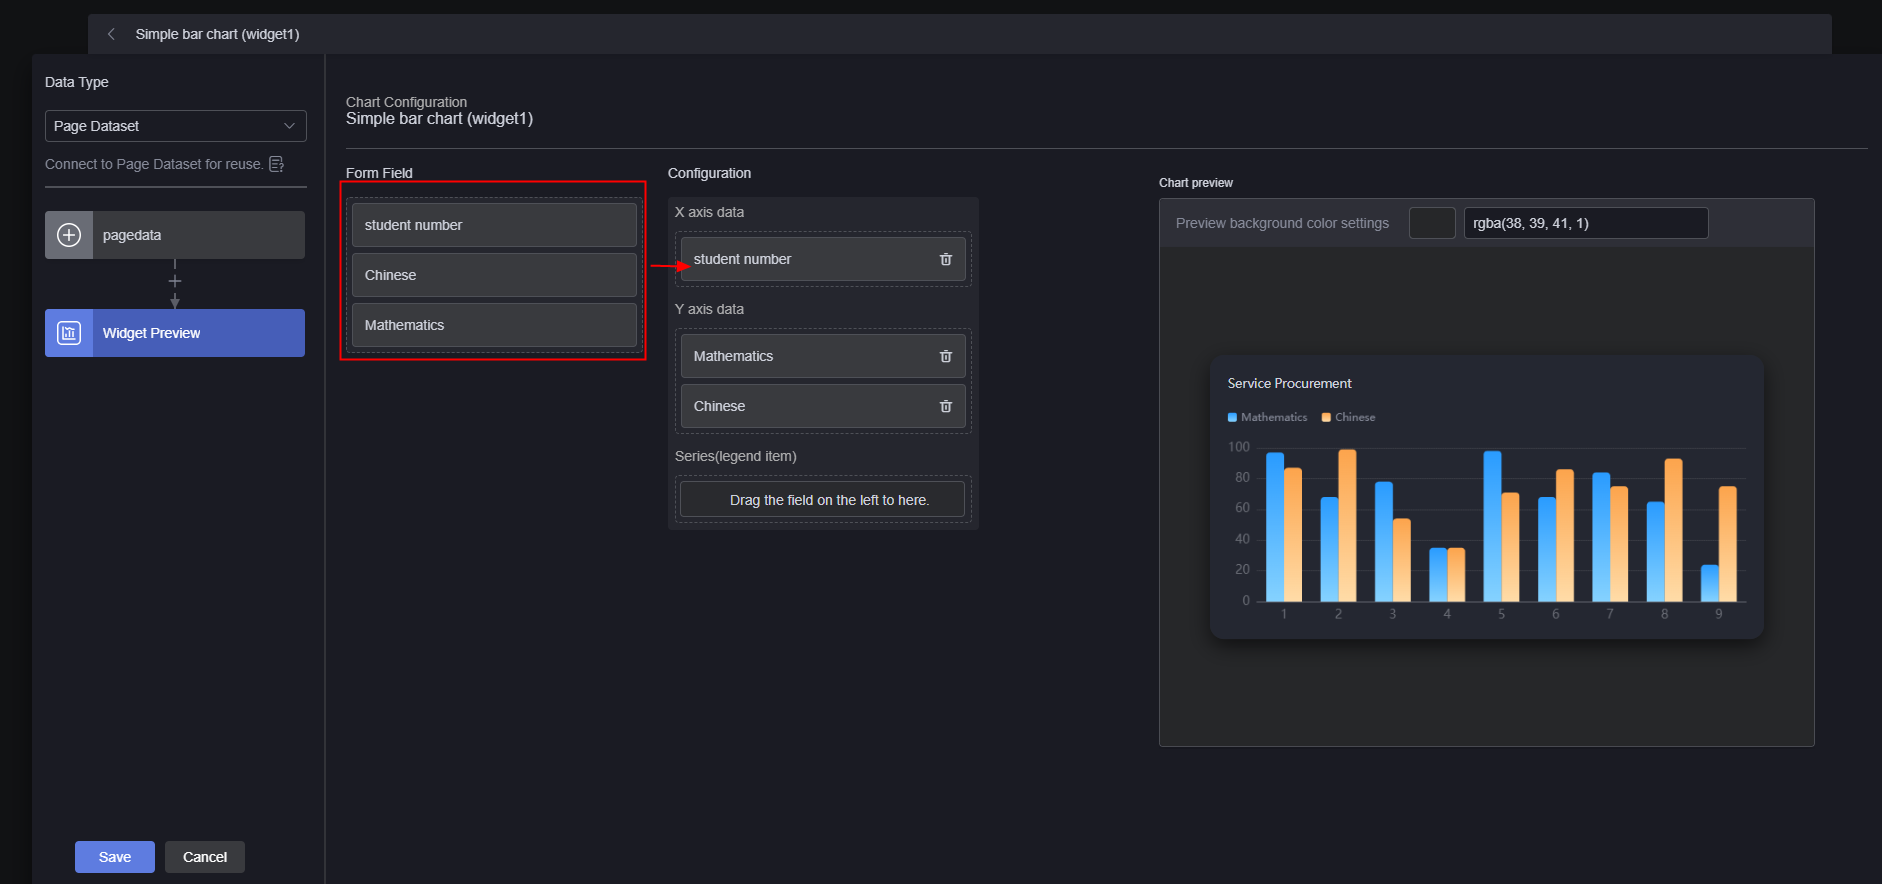
- In the widget preview, drag fields in the table to the configuration to preview the effect.
Figure 12 Preview
Feedback
Was this page helpful?
Provide feedbackThank you very much for your feedback. We will continue working to improve the documentation.See the reply and handling status in My Cloud VOC.
For any further questions, feel free to contact us through the chatbot.
Chatbot


