Viewing Log Management
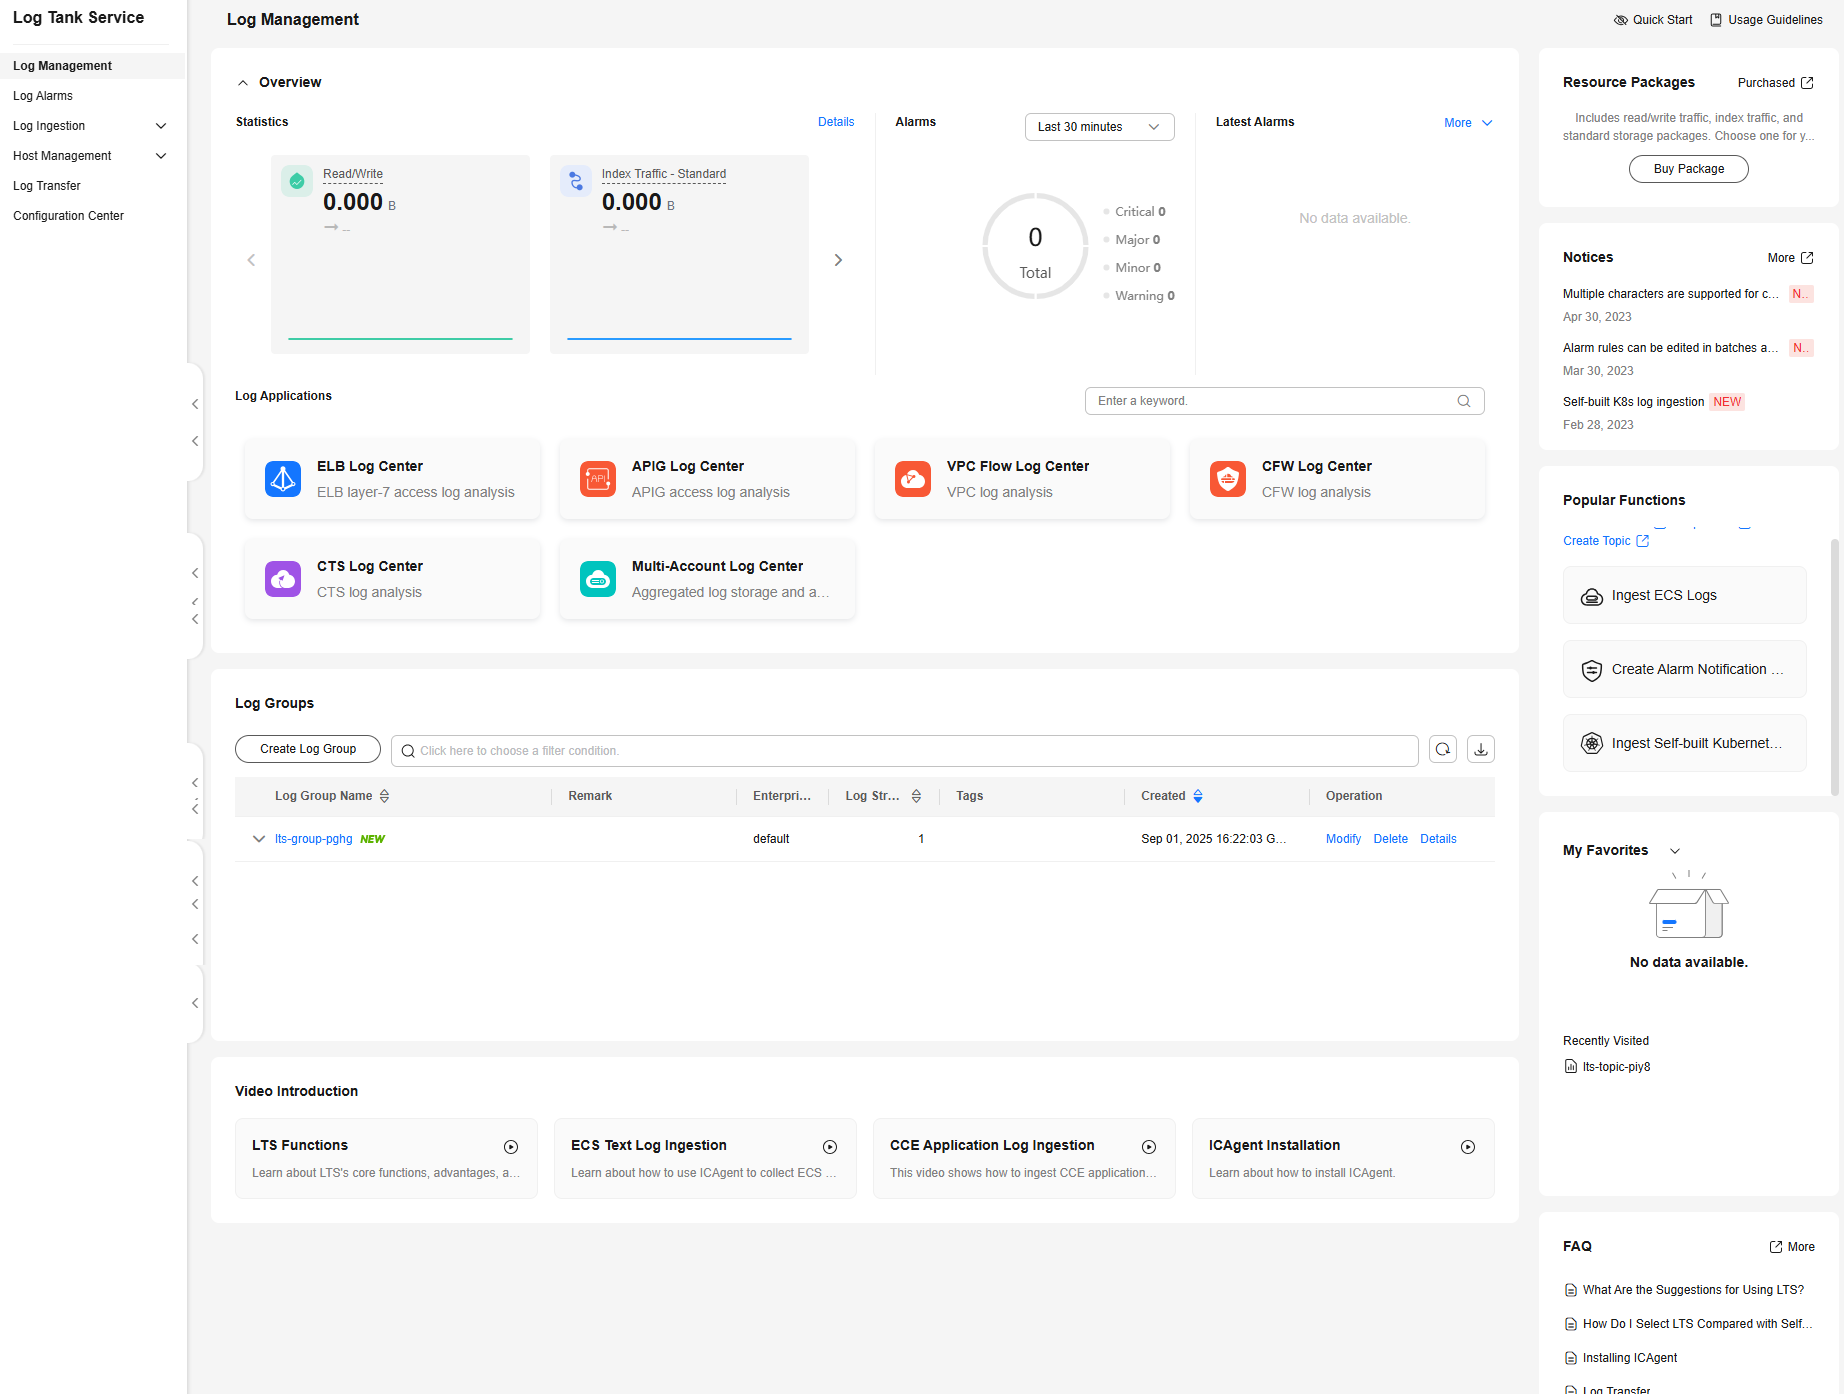
The Log Management page displays resource statistics, log applications, your favorite log streams/favorite log streams (local cache), alarm statistics, latest alarms, function release notices, and recently viewed log streams.

|
No. |
Feature |
Description |
|---|---|---|
|
1 |
This area guides beginners to quickly get started with LTS. |
|
|
2 |
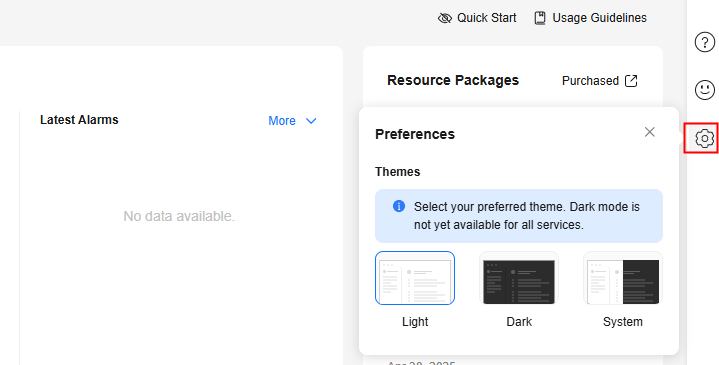
You can set the visual mode of the LTS console. The options are Light mode, Dark mode, and System theme mode (no setting). |
|
|
3 |
The Log Statistics page displays the read/write traffic, index traffic, standard storage volume, daily read/write traffic, and daily index traffic of log groups and log streams. |
|
|
4 |
This area shows alarm statistics and latest alarms. |
|
|
5 |
|
|
|
6 |
Log groups and log streams are listed under Log Groups. A log group is the basic unit for LTS to manage logs. It comprises log streams and categorizes them. By collecting and storing log data in different log streams, you can perform a variety of operations on that data by log stream, including searching, analyzing, visualizing, processing, and transferring data. You can also set specific alarm rules for it. |
|
|
7 |
LTS supports billing based on resource packages. The resource usage is deducted first from the packages during fee settlement. |
|
|
8 |
This area displays the new functions and news of LTS. |
|
|
9 |
This area provides quick access to common functions. |
|
|
10 |
This area displays the log streams you have added to favorites, including My Favorites and My Favorites(Local Cache). |
|
|
11 |
This area displays up to three log streams that are recently visited. |
|
|
12 |
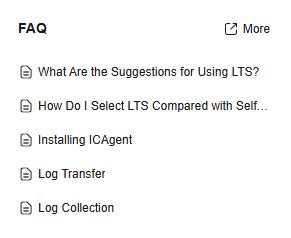
This area displays frequently asked questions. |
|
|
13 |
This area shows video tutorials for common tasks like using LTS features and ingesting ECS text logs to LTS, helping you quickly know how to use LTS. |
Quick Start
- Log in to the LTS console.
- In the upper right corner of the Log Management page, click
 to display the Quick Start area. Follow the steps below to quickly get started with LTS:
Figure 2 Quick start
- To hide Quick Start, click
 in the upper right corner of the Log Management page.
Setting a Theme
- Click
 on the right.
 - On the Preferences page, select one of the following themes for your LTS console: Light, Dark, or System.
Figure 3 Preferences

Resource Statistics
The Log Statistics page shows resource statistics and details by category in charts. The statistics are for reference only.
The Advanced button is available only to whitelisted users. To use it, choose Configuration Center in the navigation pane of the LTS console, click the Quota Configuration tab, and enable LTS Observability. For details, see Setting LTS Log Collection Quota and Usage Alarms.
- Basic: displays log resource statistics and log details.
- Advanced: displays the resource usage details and top log groups or streams by resource usage.

The LTS observability function is available only to whitelisted users in regions CN North-Beijing4, CN East-Shanghai1, CN South-Guangzhou, and AP-Singapore. To use it in these regions, submit a service ticket.
- Log in to the LTS console.
- Under Overview on the Log Management page, click Detailsor Details - Basic to access the resource statistics details page.
The Details - Basic button is displayed only after the LTS observability function (available only to whitelisted users) is enabled.
- Select a time range as required. By default, log resource statistics of the past seven days are displayed.
There are three types of time range: relative time from now, relative time from last, and specified time.
- From now: queries log data generated in a time range that ends with the current time, such as the previous 1, 5, or 15 minutes. For example, if the current time is 19:20:31 and 1 hour is selected as the relative time from now, the charts on the dashboard display the log data that is generated from 18:20:31 to 19:20:31.
- From last: queries log data generated in a time range that ends with the current time, such as the previous 1 or 15 minutes. For example, if the current time is 19:20:31 and 1 hour is selected as the relative time from last, the charts on the dashboard display the log data that is generated from 18:00:00 to 19:00:00.
- Specified: queries log data that is generated in a specified time range.
- View the resource statistics.
- Read/Write: LTS charges for the amount of compressed log data read from and written to LTS. Generally, the log compression ratio is 5:1.
- Index Traffic - Standard: Raw logs are full-text indexed (delimited) by default for log search. When logs are written to databases, traffic fees are charged at a time.
- Standard Storage Volume: Space used for storing compressed logs, indexes, and copies is billed. The space is roughly the size of the raw logs. Standard storage statistics indicate the latest total storage volume within a specified time range.
- Raw Log Traffic: size of raw logs.
- Basic Transfer Traffic: traffic for transferring logs to OBS, DMS, and DIS. Such transfers do not require field mapping and consume less computing power. This parameter is displayed only when log transfer billing is enabled.
- Advanced Transfer Traffic: traffic for transferring logs to DWS and DLI. Such transfers require field mapping and consume more computing power. This parameter is displayed only when log transfer billing is enabled.
- View the resource statistics of Log Groups (Top 100) and Log Streams (Top 100). You can select a time range and view the daily read/write traffic (GB), daily index traffic - standard (GB), daily basic and advanced transfer traffic (GB), and daily standard storage volume (GB) of this period in tables or bar charts.
- For a new log group or log stream, resource statistics will be collected in at least one hour.
- Click the name of one of the top 100 log groups to query its log stream resource statistics.
- Click
 to download the resource statistics of the log groups and streams. The downloaded files are in .CSV format.
- Return to the Log Management page and click Details - Advanced in the upper right corner of the Statistics area. On the displayed page, view the resource usage details and top resources by usage.
- On the Resource Usage Details tab page, view the raw log traffic, index traffic, and write traffic of log groups and streams. If the current version does not support a specific function, the LTS console will display no data in the related chart.
- On the Top Usage tab page, view log groups and streams sorted by raw log traffic, index traffic, and write traffic. If the current version does not support a specific function, the LTS console will display no data in the related chart.
Alarm Statistics and Latest Alarms
In the lower part of Overview, you can view alarm statistics and latest alarms.
- The Alarms area displays the total number of LTS alarms and the number of alarms of each severity (Critical, Major, Minor, and Warning). You can view alarm statistics of the last 30 minutes, last 1 hour, last 6 hours, last 1 day, or last 1 week.
- The Latest Alarms area displays a maximum of three latest alarm rules in the last 30 minutes.
- To check more alarms, click More > More.
- To add alarm rules, click More > Add Rule.
Log Applications
LTS provides multiple log applications under Overview on the Log Management page. These log applications are out-of-the-box dashboard templates for quick log analysis.
- ELB Log Center: Elastic Load Balance (ELB) logs can be ingested to LTS and displayed in the ELB dashboard templates.
- APIG Log Center: API Gateway (APIG) logs can be ingested to LTS and displayed in the APIG dashboard templates. For details, see APIG Dashboard Templates.
- VPC Flow Log Center: Virtual Private Cloud (VPC) logs can be ingested to LTS and displayed in the VPC dashboard templates. For details, see VPC Dashboard Template.
- CFW Log Center: Cloud Firewall (CFW) logs can be ingested to LTS and displayed in the CFW dashboard templates. For details, see CFW Dashboard Templates.
- CTS Log Center: Cloud Trace Service (CTS) logs can be ingested to LTS but cannot be displayed in the CTS dashboard templates. For details, see Ingesting CTS Logs to LTS.
- Multi-Account Log Center: Log streams of multiple accounts can be copied to a specified account for central storage and analysis of logs from those accounts. For details, see Setting Multi-Account Log Aggregation.
- LTS Observability: provides log traffic monitoring data measured to the minute. This function is available only to whitelisted users. For details, see Setting LTS Log Collection Quota and Usage Alarms.
Log Groups
Log groups and log streams are listed under Log Groups. For more information, see Managing Log Groups and Managing Log Streams.
Resource Packages
LTS supports billing based on resource packages. The resource usage is deducted first from the packages during fee settlement. For details, see Purchasing LTS Resource Packages.
Notices
This area displays the new functions and news of LTS.
To view more function descriptions, click More.

Popular Functions
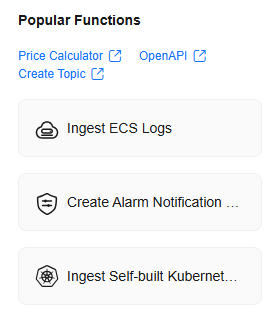
This area provides quick access to common functions. The Price Calculator, OpenAPI, and Create Topic options stay fixed at the top, while three common functions are displayed in the lower part. Click them to access the page for using the corresponding function.

My Favorites/My Favorites (Local Cache)
This area displays the log streams you have added to favorites, including My Favorites and My Favorites(Local Cache).
- My Favorites: Save log streams to the LTS database. This function is disabled by default. If your account has the write permission, My Favorites and My Favorites(Local Cache) are displayed.
- My Favorites(Local Cache): Save log streams to the local cache of the browser. This function is disabled by default. After you clear the browser history, your favorites will be deleted. This parameter is displayed for both writable and read-only users.
If your account has the write permission, at least one of My Favorites and My Favorites(Local Cache) is enabled. Otherwise, log streams cannot be added to favorites.
Adding frequently used log streams to your favorites helps you quickly locate them.
The following example shows how to add a log stream of log group lts-test to favorites:
- In the Log Groups list, click
 on the left of log group lts-test.
 - Click More > Edit in the Operation column of the target log stream. On the displayed dialog box, enable My Favorites and/or My Favorites(Local Cache) and click OK.
- After the log stream is added to favorites, it is displayed in My Favorites/My Favorites(Local Cache) on the right.
Feedback
Was this page helpful?
Provide feedbackThank you very much for your feedback. We will continue working to improve the documentation.See the reply and handling status in My Cloud VOC.
For any further questions, feel free to contact us through the chatbot.
Chatbot


