
Creating a Custom Component
This section describes how to register, debug, and publish a custom component.
Step 1: Register a Custom Component
- Log in to the DataArts Insight console.
- Click
 in the upper left corner of the management console to select a region. Then, click Project on the top menu of the console. On the displayed page, click the name of the desired project.
 - Click the name of the desired project in the My Projects area in the right pane.
- In the navigation pane on the left, choose Work Management > Custom Component.
- Click Register Component in the upper right corner of the page.
- In the displayed dialog box, set parameters and click OK.
Table 1 Parameters for registering a component Parameter
Description
Component Name
Enter a component name, which cannot be changed once registered.
Icon
Component display icon, which can be customized. If you do not select one, the default icon will be used.
Application Scope
You can only select Screen or Dashboard.
Applicable Platform
You can only select PC.
Development Buddle
Upload the developed package, which should be in zip format and no larger than 40 MB.
Description
Description of the custom component. You can enter a maximum of 200 characters.
Step 2: Download the Developer Tools and Create a Development Package
- Click Download Developer Tool in the upper right corner of the developer platform page to download the development package and save it to the local host.
- Extract the package and configure it. For details, see Custom Component Development Package.

To create a custom component, use Node.js 20 or later and npm 10.5.0 or later.
- Go to the insight-dev-tools folder and open the command line as a Windows system administrator.
npm install
- Perform internal linking within the component.
npm link
- Initialize the component.
insight init
Figure 1 Initialization
- 1 indicates the initialization command.
- 2 indicates that the language.
- 3 indicates the component name, which can be customized.
- 4 indicates the component alias, which can be customized.
- 5 indicates the component version, which can be customized.
- 6 indicates the component description, which can be customized.
- After initialization, the src directory will appear in the insight-dev-tools folder, which contains the configuration directory for the component.
Figure 2 src directory
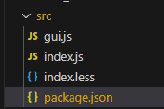
- gui.js: component configuration, including the style, data, and interaction.
- index.js: implementation configuration file.
- index.less: style configuration file.
- package.json: dependency package file.
- Enter the src directory, build the component, and a dist folder will appear in the src directory after building (the index.js in dist refers to the current implementation of the component package).
- Go to the src directory.
cd .\src\
- Build the component.
insight build
- Go to the src directory.
Step 3: Debug the Component
- Once the development package is created, connect the local component to the console to debug it.
- Debug the component on the local host and obtain the debugging port.
insight start
- On the developer platform page, click Debug in the Operation column of the component. In the displayed dialog box, set parameters. (Set Debug Port to the value obtained in Figure 3.)
Table 2 Parameters for debugging a custom component Parameter
Description
Component Name
Custom component name.
Debug Target
Local Bundle: development package obtained from the local host.
Application Scope
The value can be Screen or Dashboard.
Project
Select a project for debugging, and use the data from that project for debugging purposes.
Screen/Dashboard
Select a large screen or dashboard for debugging.
Debug Port
Enter the debugging port and validate it by only entering numbers.
- Specify different ports to debug different development packages on the local development server.
- Debugging port is only required for local package debugging, and is not needed for the release package mode.
- In local package mode, if the debugging port is not filled in, clicking Debug will prompt you to enter the debugging port.
- Click OK. On the displayed page, debug the component.
- Build the component.
insight build

Step 4: Upload the Development Package
- Once the debugging is complete on the console, package the custom component locally and a zip file will appear in the list folder.
insight pack
Figure 4 ZIP file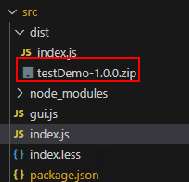
- Go to the developer platform page, select the custom component whose development package has not been uploaded, and click Edit in the Operation column. In the displayed Edit Component dialog box, upload the local development package.
- Click OK.
Step 5: Publish the Custom Component
- In the custom component list, locate the row containing the created custom component and click Publish in the Operation column.
- The custom component changes to the Published state. Return to the Workspace page and select an enterprise project in Enterprise Project.
- Click the name of a project in the My Projects area on the right. In the navigation pane on the left, choose Data Analytics > Large Screen or Dashboard. On the displayed page, click Create Screen or Create Dashboard in the upper right corner.
- On the displayed page, click Custom on the left. The published components are displayed in the list. Drag a custom component to the canvas for configuration. For details, see Creating a Large Screen/Creating a Dashboard.
Feedback
Was this page helpful?
Provide feedbackThank you very much for your feedback. We will continue working to improve the documentation.See the reply and handling status in My Cloud VOC.
For any further questions, feel free to contact us through the chatbot.
Chatbot


