Managing Charts
DataArts Insight supports switching between different chart types as your business data changes and you need to adjust the chart display. This section describes how to switch the chart type.
Prerequisites
- A project has been created by referring to Creating a Project.
- A data source has been connected by referring to Creating a Data Source.
- A dataset has been created by referring to Creating a Dataset.
- A dashboard has been created by referring to Creating a Dashboard.
Switching the Chart Type
- In the navigation pane on the left, choose Data Analytics > Dashboard.
- Click the name of the desired dashboard.
- Click
 in the upper right corner of the chart and select Switch chart type.
 - Click the target chart type. The system automatically updates the chart.
Figure 1 Switching the chart type

Copying a Chart
- In the navigation pane on the left, choose Data Analytics > Dashboard.
- Click the name of the desired dashboard.
- Click
 in the upper right corner of the chart and select Copy. The system creates a copy of the chart in the dashboard.
Viewing Data
- In the navigation pane on the left, choose Data Analytics > Dashboard.
- Click the name of the desired dashboard.
- Click
 in the upper right corner of the chart and select View data. The data viewing dialog box appears.
- Data Type: The options are Formatted data and Raw data.
- To view the data, click the copy button in the upper right corner, paste the data in the related file, and click Export Excel.
Exporting Files
- In the navigation pane on the left, choose Data Analytics > Dashboard.
- Click the name of the desired dashboard.
- Click
 in the upper right corner of the chart and select Export File.
 - In the dialog box that appears, set the parameters based on Table 1.
Table 1 Parameters for exporting a file Parameter
Description
Export Name
Name of the control to be exported. The default name is in Chart title_Date_Export time format.
File Format
File format. The options are Image, PDF, EXCEL, and WORD.
Watermarking
If you select Display watermark, the exported file will show the watermark. If you select Hide watermark, the exported file will not show the watermark.
Export Path
You can export the chart to a local host.
- Click OK.

Be cautious when exporting data as there may be a risk of personal data leakage.
Viewing SQL Statements
- In the navigation pane on the left, choose Data Analytics > Dashboard.
- Click the name of the desired dashboard.
- Click
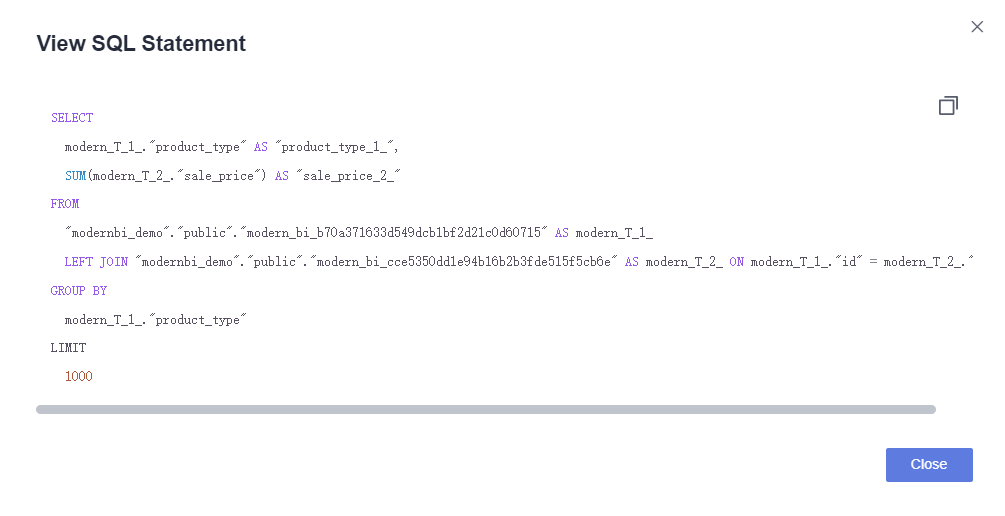
 in the upper right corner of the chart and select View SQL Statement.
Figure 2 Viewing SQL statements
Fixing and Deleting a Chart
- In the navigation pane on the left, choose Data Analytics > Dashboard.
- Click the name of the desired dashboard.
- Click
 in the upper right corner of the chart and select Fix or Delete.
- Fix: After clicking Fix, you cannot move the chart. To undo the fixing, click
 in the upper right corner of the chart and select Unfix.
 - Delete: Clicking Delete will delete the chart. Once deleted, the chart cannot be restored.
- Fix: After clicking Fix, you cannot move the chart. To undo the fixing, click
Feedback
Was this page helpful?
Provide feedbackThank you very much for your feedback. We will continue working to improve the documentation.See the reply and handling status in My Cloud VOC.
For any further questions, feel free to contact us through the chatbot.
Chatbot


