
Dashboard
Dashboard displays overall information about your instance, such as the status, engine distribution, active alarms, slow query logs, monitoring dashboards, and resource risky instance. It also displays detected exceptions and provides handling suggestions with intelligent diagnosis.
Instance Status
You can view the number of instances by status in the current region, including primary instances and read replicas.

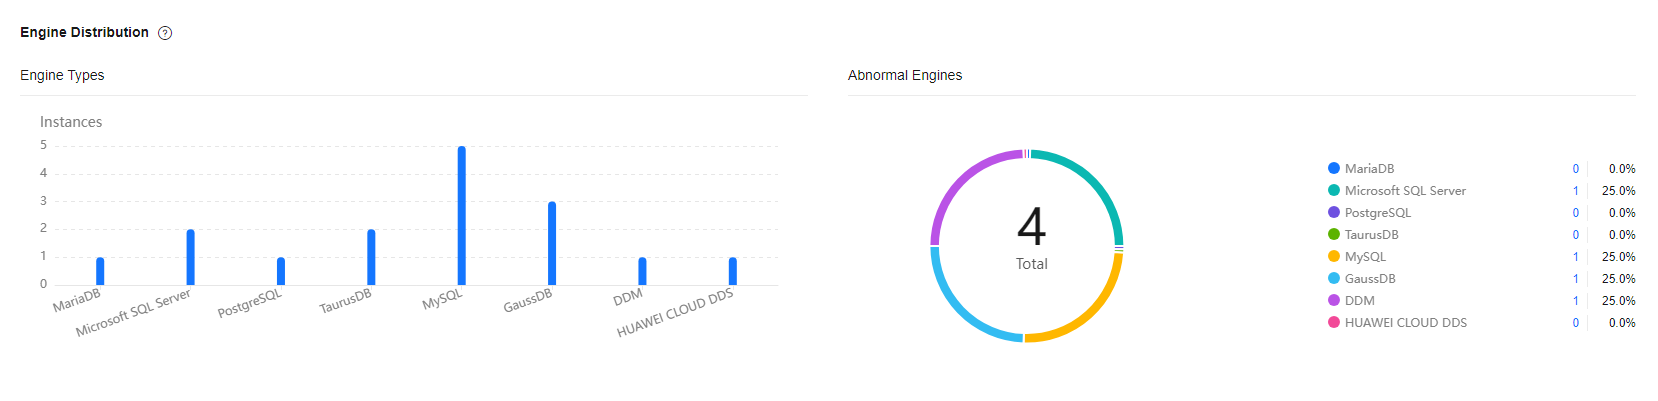
Engine Distribution
You can view the distribution of engines in the current region, including engine types and abnormal engines.
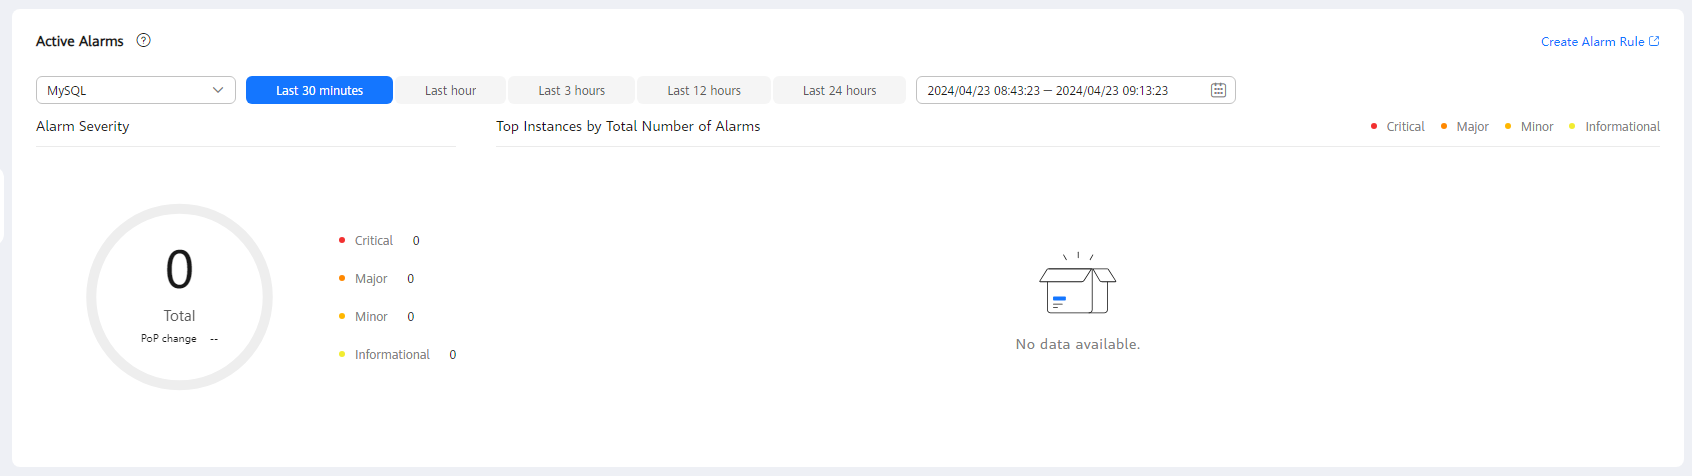
Active Alarms
You can view active alarms of all instances in the current region, including alarms in the Alarm (metric) and Triggered (event) statuses.
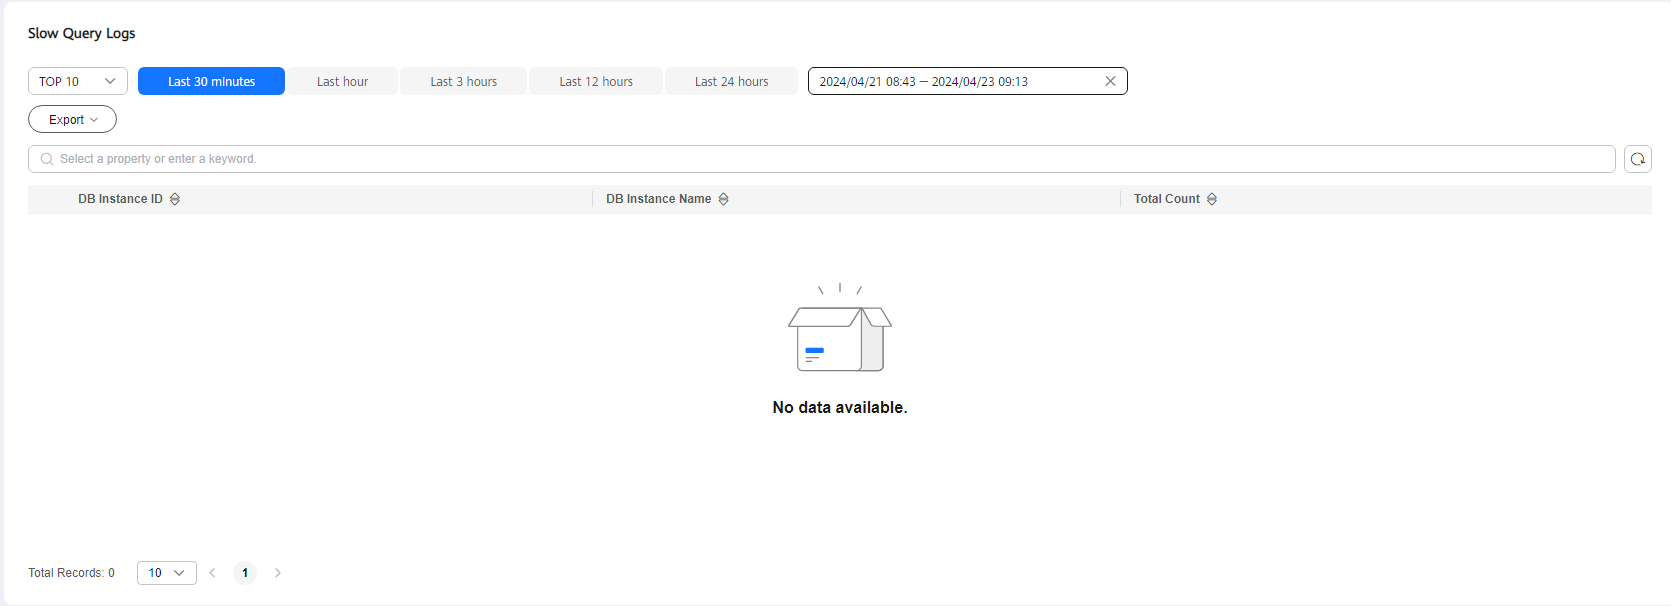
Slow Query Logs
You can view the number of slow query logs of all instances in the current region.
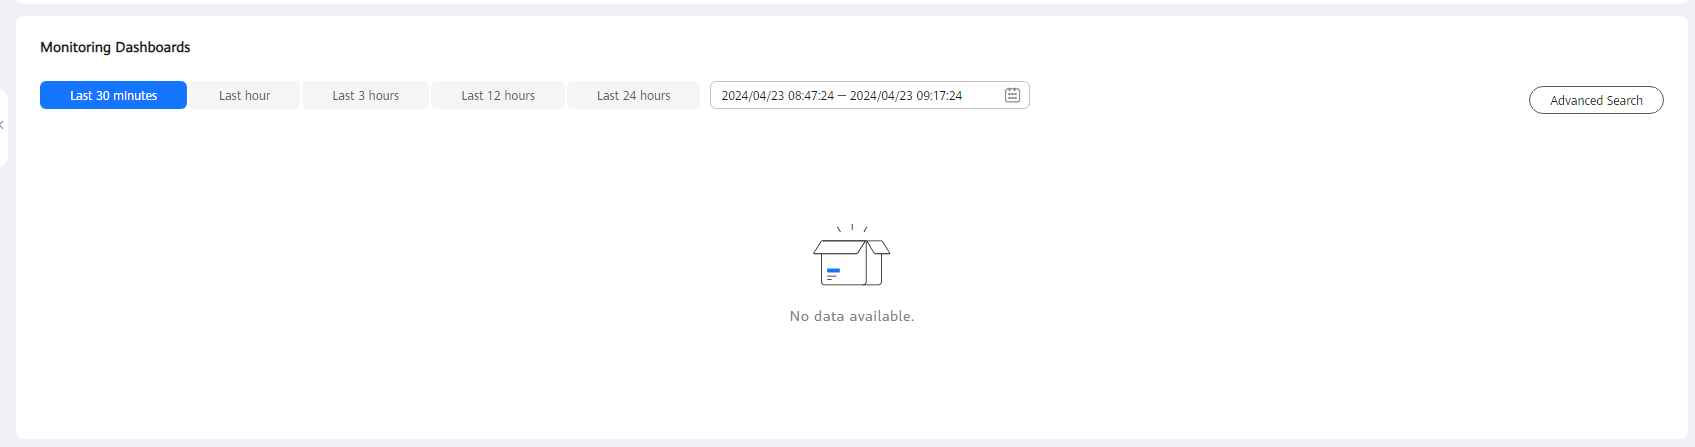
Monitoring Dashboards
You can view metrics of all instances in the current region.
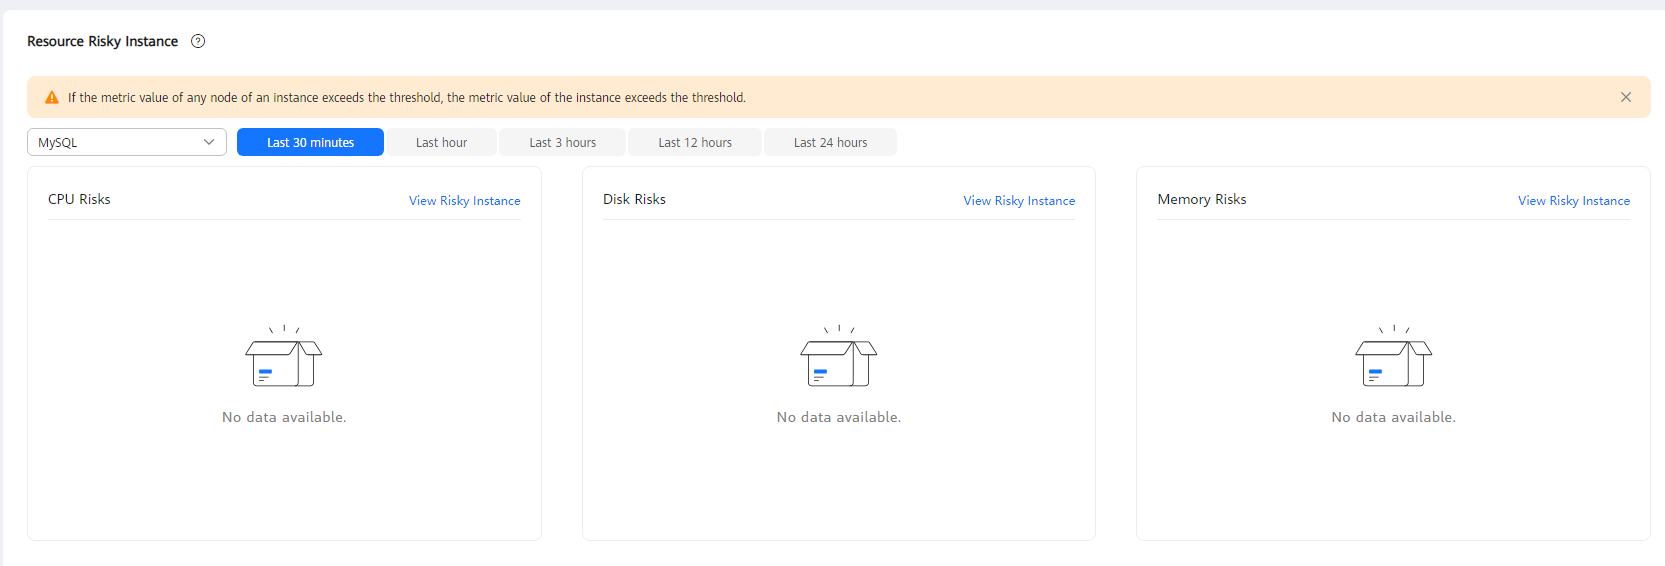
Risky Instance
You can view risky metrics of instances in the current region.
Feedback
Was this page helpful?
Provide feedbackThank you very much for your feedback. We will continue working to improve the documentation.See the reply and handling status in My Cloud VOC.
For any further questions, feel free to contact us through the chatbot.
Chatbot


